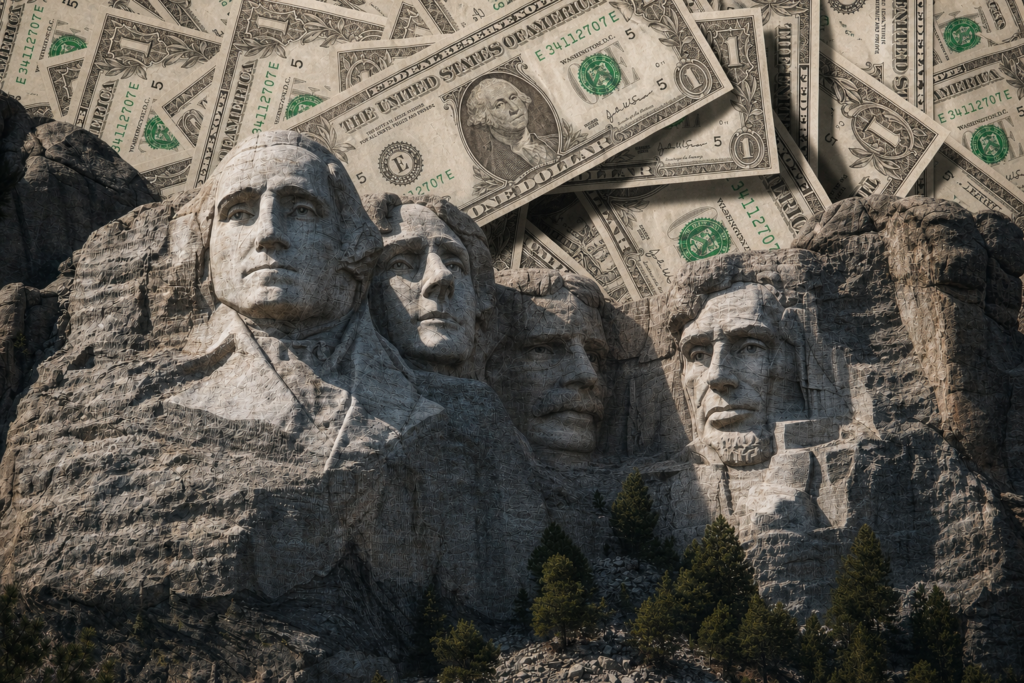

U.S. inflation by president reveals a century of wars, depressions, oil shocks, policy experiments, financial crises, and pandemic disruption. However, a presidential ranking can mislead unless it also explains timing and causation. Presidents influence taxes, spending, trade, regulation, and appointments. They do not set interest rates, control oil fields, end supply shortages, or determine every price.
This article compares annual inflation and deflation across every presidential administration from 1900 through 2025. It reports average inflation, compound inflation, cumulative price change, inflation years, deflation years, peaks, and lows. Moreover, it explains how price movements affected each administration’s policies, public standing, legislative power, and electoral environment.
The main table uses the annual change in the GDP price deflator. That measure provides the only consistent broad-output series in this project back to 1900. For the full annual dataset and event history, see the U.S. inflation rate history from 1900 to 2025.
U.S. Inflation by President: The Quick Answer
Woodrow Wilson recorded the highest average annual rate in this series, at 9.22%. World War I mobilization, wartime finance, supply pressure, and the postwar boom drove that result. By contrast, Herbert Hoover recorded the lowest average, at -6.32%, during the collapse of demand, credit, banks, output, and employment in the Great Depression.
Jimmy Carter had the second-highest administration average, at 7.64%. Gerald Ford followed at 7.38%. Nevertheless, both inherited an inflation process that began during the 1960s and intensified after oil shocks. Therefore, these rankings describe what happened during a presidency, not what one president caused alone.
The table contains 23 administration segments but 22 people. Donald Trump appears twice because his terms were not consecutive. In addition, the second Trump segment includes only 2025. Readers should not compare that single year directly with a four-year or eight-year presidency.
| President or administration | Party | Assigned years | Average annual rate | Compound annual rate | Cumulative price change | Inflation/deflation years |
|---|---|---|---|---|---|---|
| William McKinley | Republican | 1900-1901 | 2.83% | 2.83% | 5.74% | 2/0 |
| Theodore Roosevelt | Republican | 1902-1908 | 2.94% | 2.92% | 22.29% | 6/1 |
| William Howard Taft | Republican | 1909-1912 | 1.18% | 1.16% | 4.71% | 2/2 |
| Woodrow Wilson | Democratic | 1913-1920 | 9.22% | 8.94% | 98.34% | 8/0 |
| Warren G. Harding | Republican | 1921-1923 | -5.83% | -6.10% | -17.21% | 1/2 |
| Calvin Coolidge | Republican | 1924-1928 | -0.13% | -0.14% | -0.69% | 3/2 |
| Herbert Hoover | Republican | 1929-1932 | -6.32% | -6.45% | -23.41% | 1/3 |
| Franklin D. Roosevelt | Democratic | 1933-1944 | 2.44% | 2.38% | 32.69% | 9/3 |
| Harry S. Truman | Democratic | 1945-1952 | 5.24% | 5.15% | 49.45% | 7/1 |
| Dwight D. Eisenhower | Republican | 1953-1960 | 1.95% | 1.94% | 16.63% | 8/0 |
| John F. Kennedy | Democratic | 1961-1963 | 1.14% | 1.14% | 3.47% | 3/0 |
| Lyndon B. Johnson | Democratic | 1964-1968 | 2.66% | 2.66% | 14.02% | 5/0 |
| Richard Nixon | Republican | 1969-1974 | 5.68% | 5.67% | 39.18% | 6/0 |
| Gerald Ford | Republican | 1975-1976 | 7.38% | 7.37% | 15.28% | 2/0 |
| Jimmy Carter | Democratic | 1977-1980 | 7.64% | 7.64% | 34.23% | 4/0 |
| Ronald Reagan | Republican | 1981-1988 | 4.29% | 4.27% | 39.72% | 8/0 |
| George H. W. Bush | Republican | 1989-1992 | 3.33% | 3.33% | 14.00% | 4/0 |
| Bill Clinton | Democratic | 1993-2000 | 1.87% | 1.87% | 15.97% | 8/0 |
| George W. Bush | Republican | 2001-2008 | 2.42% | 2.41% | 21.03% | 8/0 |
| Barack Obama | Democratic | 2009-2016 | 1.38% | 1.38% | 11.62% | 8/0 |
| Donald Trump, first term | Republican | 2017-2020 | 1.77% | 1.77% | 7.26% | 4/0 |
| Joe Biden | Democratic | 2021-2024 | 4.46% | 4.45% | 19.03% | 4/0 |
| Donald Trump, second term through 2025 | Republican | 2025 | 2.83% | 2.83% | 2.83% | 1/0 |
Peaks and lows under every president
The next table shows each administration’s highest and lowest annual GDP-deflator rate. As a result, it separates a typical year from a sudden shock.
| President or administration | Highest annual rate | Lowest annual rate |
| William McKinley | 2.9% in 1900 | 2.8% in 1901 |
| Theodore Roosevelt | 6.3% in 1907 | -0.2% in 1908 |
| William Howard Taft | 4.0% in 1912 | -1.4% in 1909 |
| Woodrow Wilson | 23.3% in 1917 | 0.7% in 1913 |
| Warren G. Harding | 2.8% in 1923 | -14.8% in 1921 |
| Calvin Coolidge | 1.8% in 1925 | -2.4% in 1927 |
| Herbert Hoover | 0.3% in 1929 | -11.7% in 1932 |
| Franklin D. Roosevelt | 8.0% in 1942 | -2.9% in 1938 |
| Harry S. Truman | 12.9% in 1946 | -0.2% in 1949 |
| Dwight D. Eisenhower | 3.4% in 1956 | 0.9% in 1954 |
| John F. Kennedy | 1.2% in 1962 | 1.1% in 1961 |
| Lyndon B. Johnson | 4.3% in 1968 | 1.5% in 1964 |
| Richard Nixon | 9.0% in 1974 | 4.3% in 1972 |
| Gerald Ford | 9.3% in 1975 | 5.5% in 1976 |
| Jimmy Carter | 9.0% in 1980 | 6.2% in 1977 |
| Ronald Reagan | 9.5% in 1981 | 2.0% in 1986 |
| George H. W. Bush | 3.9% in 1989 | 2.3% in 1992 |
| Bill Clinton | 2.4% in 1993 | 1.1% in 1998 |
| George W. Bush | 3.1% in 2005 | 1.6% in 2002 |
| Barack Obama | 2.1% in 2011 | 0.6% in 2009 |
| Donald Trump, first term | 2.3% in 2018 | 1.3% in 2020 |
| Joe Biden | 7.1% in 2022 | 2.5% in 2024 |
| Donald Trump, second term through 2025 | 2.8% in 2025 | 2.8% in 2025 |
How This U.S. Inflation by President Study Works
The main measure is the GDP price deflator
The GDP deflator measures price changes for final goods and services produced in the United States. Therefore, it includes exports and excludes imports. The Bureau of Economic Analysis explains that coverage.
Official annual observations begin in 1929. This study uses BEA NIPA Table 1.1.9 for 1929-2025, distributed through FRED series A191RD3A086NBEA. FRED reports a 2025 index of 128.979 and a 2024 index of 125.428. Consequently, the 2025 annual rate equals 2.83%.
For 1900-1928, the series uses the Johnston-Williamson historical reconstruction. MeasuringWorth documents the historical estimates and the link to BEA data. Thus, early values are scholarly reconstructions rather than modern government observations.
CPI and PCE answer different questions
The GDP deflator is broad, but households often experience inflation through the Consumer Price Index. Accordingly, the Bureau of Labor Statistics defines CPI as the average change in prices paid by urban consumers for a market basket. Thus, CPI works better for purchasing-power calculators and household budgets.
Meanwhile, the Federal Reserve targets PCE inflation. The Fed defines its longer-run 2% goal using the annual change in the Personal Consumption Expenditures price index. Therefore, a president’s GDP-deflator rate, CPI rate, and PCE rate can differ without any error.
Annual observations are assigned by majority of the calendar year
An annual price index cannot cleanly divide a transition year at inauguration day. This study assigns each year to the president who served for most of that calendar year. Consequently, 1945 belongs to Truman because he took office in April. By contrast, 1974 belongs to Nixon because he served until August.
Regular inauguration years belong to the incoming president because that person served for nearly the full year. Similarly, 2025 belongs to Trump’s second administration. Still, the rate includes economic activity and prices from the entire calendar year, including January 1-19.
This rule improves consistency, but it cannot remove policy lags. A tax law, interest-rate decision, war, or supply shock may affect prices months or years later. Therefore, the table assigns observations, not moral responsibility.
Three statistics answer three different questions
Average annual inflation is the arithmetic mean of the assigned yearly rates. It answers, “What was a typical annual rate?” However, it does not measure the full price-level increase.
Compound annual inflation uses the geometric mean. It answers, “At what constant yearly pace would the price level reach the same final value?” Consequently, it works well across presidencies of different lengths.
Cumulative price change multiplies every annual movement. It answers, “How much did the price level rise or fall across all assigned years?” Because longer presidencies have more time to accumulate change, readers should not rank unequal terms by that figure alone.
Inflation under a president is not inflation caused by a president
The White House can affect inflation through fiscal policy, trade policy, regulation, energy policy, and leadership appointments. Congress also shapes those choices. However, the Federal Reserve controls short-term interest rates and monetary conditions.
Global events matter as well. Wars can raise federal demand and disrupt supply. Oil shocks can lift transportation and production costs. Financial crises can destroy demand. Pandemics can close factories while fiscal relief supports spending. Moreover, expectations can keep inflation alive after the original shock fades.
For that reason, each section separates four elements: inherited conditions, external shocks, administration policy, and consequences. That framework gives a fairer account than a simple leaderboard.
Which Presidents Had the Highest and Lowest Inflation?
Highest average annual inflation
| Rank | President | Average annual rate | Main historical driver |
| 1 | Woodrow Wilson | 9.22% | World War I mobilization, finance, shortages, postwar boom |
| 2 | Jimmy Carter | 7.64% | Entrenched Great Inflation, second oil shock, expectations |
| 3 | Gerald Ford | 7.38% | First oil shock aftermath and stagflation |
| 4 | Richard Nixon | 5.68% | Inherited inflation, expansion, controls, Bretton Woods exit, oil shock |
| 5 | Harry S. Truman | 5.24% | Price-control removal, postwar repricing, Korean War |
Wilson’s eight assigned years nearly doubled the broad domestic price level. In fact, his cumulative increase reached 98.34%. No other administration segment in this study came close.
Nevertheless, the 1970s results require a chain-of-causation view. The Federal Reserve History account of the Great Inflation connects the episode to monetary accommodation, fiscal pressure, oil shortages, unstable inflation expectations, and policy errors across several administrations.
Lowest average inflation and deepest deflation
| Rank | President | Average annual rate | Main historical driver |
| 1 | Herbert Hoover | -6.32% | Great Depression, banking panics, monetary contraction |
| 2 | Warren G. Harding | -5.83% | Post-World War I monetary tightening and recession |
| 3 | Calvin Coolidge | -0.13% | Mild price declines during otherwise strong 1920s growth |
| 4 | John F. Kennedy | 1.14% | Low post-Accord inflation and economic slack |
| 5 | William Howard Taft | 1.18% | Pre-Fed price volatility with two deflation years |
Hoover’s four assigned years reduced the GDP price level by 23.41%. Yet the single deepest deflation year occurred under Harding. Prices fell 14.78% in 1921 after the Fed tightened against postwar inflation.
Low inflation is usually helpful, while severe deflation is dangerous. Deflation raises the real burden of fixed debts, encourages delayed purchases, squeezes revenue, and can deepen unemployment. Therefore, Hoover’s low ranking reflects economic disaster rather than successful price stability.
A critical curiosity: party means and medians disagree
When every assigned year receives equal weight, Democratic years average 3.94% and Republican years average 1.95%. However, the Democratic median is 2.20%, below the Republican median of 2.63%.
| Party of assigned president | Calendar years | Arithmetic mean | Median | Inflation years | Deflation years |
| Republican | 66 | 1.95% | 2.63% | 56 | 10 |
| Democratic | 60 | 3.94% | 2.20% | 56 | 4 |
World War I, postwar inflation, and the 2021-2022 surge pull the Democratic mean upward. Conversely, the 1921 collapse and Great Depression pull the Republican mean downward. The median reverses the apparent party advantage because it reduces the influence of extreme years.
Consequently, party averages do not identify a party effect. They mainly reveal which party occupied the White House during historically unusual shocks. Any serious causal comparison would also control for inherited inflation, Fed policy, war, recessions, Congress, energy prices, and global supply.
U.S. Inflation by President Before and During World War I
William McKinley, 1900-1901
McKinley’s assigned years averaged 2.83% inflation. Prices rose 5.74% across 1900 and 1901, while neither year recorded deflation. The result reflects a growing industrial economy under the gold standard, before the Federal Reserve existed.
Nevertheless, the short segment limits interpretation. McKinley served through most of 1901, but an assassin killed him in September. His administration did not face an inflation crisis, and price change did not drive its abrupt end.
The larger consequence was institutional vulnerability. At that time, the United States lacked a central bank that could provide elastic currency or coordinated emergency liquidity. Therefore, future financial panics would expose weaknesses that ordinary price averages did not show.
Theodore Roosevelt, 1902-1908
Roosevelt’s assigned years averaged 2.94%, and the price level increased 22.29%. Inflation reached 6.33% in 1907. Then mild deflation of -0.20% appeared in 1908 as recession followed a financial panic.
The Federal Reserve History study of the Panic of 1907 calls it the first worldwide financial crisis of the twentieth century. Moreover, it explains that the panic turned a recession into a severe contraction. Private coordination led by J. P. Morgan helped stop the panic, but that rescue exposed the system’s dependence on a few financiers.
As a result, the crisis strengthened the monetary reform movement. Congress created the National Monetary Commission in 1908, and the reform process eventually produced the Federal Reserve Act. Thus, Roosevelt’s most important inflation-era consequence was not a price-control program. It was momentum for a new central banking system.
William Howard Taft, 1909-1912
Taft’s four assigned years averaged only 1.18%, while cumulative prices rose 4.71%. Still, the period included two inflation years and two deflation years. Prices fell 1.38% in 1909 and 0.51% in 1911, but they rose 3.98% in 1912.
Such swings illustrate the pre-Fed monetary system. A low average can hide alternating inflation and deflation, especially when financial conditions and gold flows change. Therefore, Taft’s record should not be treated as four years of smooth price stability.
Meanwhile, lawmakers and bankers continued to debate the central-bank response to the Panic of 1907. The institutional work advanced during Taft’s presidency, although Congress passed the final Federal Reserve Act under Wilson. Consequently, Taft’s price record sat between the panic that prompted reform and the law that completed it.
Woodrow Wilson, 1913-1920
Wilson recorded the highest presidential average in the dataset, at 9.22%. Every assigned year had inflation, while the cumulative price level rose 98.34%. The peak came in 1917, when the GDP-deflator rate reached 23.32%.
The sequence began before U.S. entry into World War I. European demand pulled American exports higher, while gold inflows expanded the money stock. After the United States entered the war, federal spending, mobilization, scarce materials, and easy war finance intensified pressure.
The Federal Reserve’s World War I history explains that federal outlays for troops and munitions increased fifteenfold from 1916 to 1918. In addition, the Fed offered favorable credit to support Treasury securities. Those policies financed victory, but they also expanded money and credit.
Politically, high living costs aggravated labor conflict and public fatigue. However, inflation was only one force among wartime casualties, the influenza pandemic, racial violence, strikes, and Wilson’s League of Nations fight. Republicans captured Congress in 1918 and won the presidency in 1920. Therefore, price pressure weakened the governing environment without providing a single-cause explanation for those outcomes.
Wilson also signed the Federal Reserve Act in 1913. The history of the Fed’s formative years shows that the new institution quickly faced war finance and inflation. Consequently, his administration created the central bank and immediately tested its independence.
Postwar Deflation and the Roaring Twenties
Warren G. Harding, 1921-1923
Harding’s assigned years averaged -5.83%, and prices fell 17.21% cumulatively. The 1921 decline of -14.78% remains the deepest annual deflation in the full 1900-2025 series. Another 5.48% decline followed in 1922, although prices rose 2.78% in 1923.
The Fed had raised its discount rate sharply in 1920 after wartime inflation. Subsequently, output contracted, unemployment rose, commodity prices collapsed, and borrowers faced heavier real debts. Farmers and rural banks suffered especially because crop prices fell while loan obligations remained fixed.
However, the downturn was brief compared with the Great Depression. The Miller Center’s Harding-era summary notes that output rebounded strongly in 1921-1922 and unemployment fell sharply by 1923. Therefore, Harding benefited politically from recovery even though his assigned average remains deeply negative.
The episode also shows why “lowest inflation” is an ambiguous compliment. Falling prices restored some purchasing power, but rapid deflation damaged debtors, businesses, workers, and banks. In short, price stability and price collapse are not the same outcome.
Calvin Coolidge, 1924-1928
Coolidge’s assigned years averaged -0.13%, making him the third-lowest administration in the ranking. Cumulative prices fell only 0.69%, while three years had inflation and two had deflation. The lowest rate was -2.39% in 1927.
At first glance, that pattern looks ideal. Growth was strong, unemployment fell, consumer products spread, and the overall price level barely moved. The Miller Center’s Coolidge analysis explains why contemporaries celebrated “Coolidge Prosperity.” Accordingly, stable goods prices helped the administration claim competent economic stewardship.
Yet a broad price index did not capture every vulnerability. Farm incomes remained weak, credit expanded, margin borrowing grew, and asset prices surged. Moreover, income gains were uneven. Consequently, low inflation did not guarantee financial stability or balanced prosperity.
That distinction matters for modern comparisons. Consumer or output-price stability can coexist with leverage, asset bubbles, and sectoral hardship. Therefore, Coolidge’s near-zero average should be read as a price result, not a complete economic score.
U.S. Inflation by President During Depression, Recovery, and World War II
Herbert Hoover, 1929-1932
Hoover had the lowest administration average, at -6.32%. Prices fell 23.41% across his four assigned years. Although 1929 posted mild inflation of 0.35%, the rate dropped to -3.68% in 1930, -10.33% in 1931, and -11.69% in 1932.
This deflation did not make Americans richer. Instead, incomes, output, employment, and collateral values collapsed. Fixed debts became harder to repay because each dollar of debt represented more real purchasing power. Meanwhile, bank failures destroyed deposits and restricted credit.
The Federal Reserve History account of the Great Depression identifies monetary-policy errors and the failure to act effectively as lender of last resort. It also describes the stock crash, regional banking panics, international crises, and the 1933 banking collapse. Therefore, responsibility extended far beyond the White House.
Hoover tried public works, lending programs, voluntary business cooperation, and the Reconstruction Finance Corporation. Nevertheless, those measures did not stop the downward spiral. The scale of deflation also overwhelmed his insistence that recovery remained near.
Consequently, economic collapse destroyed Hoover’s political standing. Franklin Roosevelt defeated him decisively in 1932, while Democrats expanded their power in Congress. Deflation became a governing crisis because it deepened unemployment, raised real debt, reduced tax revenue, and discredited existing policy.
Franklin D. Roosevelt, 1933-1944
Roosevelt’s assigned years averaged 2.44%, while prices rose 32.69% cumulatively. However, that average joins three very different periods: Depression-era reflation, renewed deflation in 1938-1939, and wartime inflation under controls.
Prices still fell 2.82% in 1933 because the economy entered his term near the Depression trough. Roosevelt then closed banks temporarily, changed the gold regime, supported farm prices, expanded relief, and pursued reflation. The Federal Reserve History analysis of Roosevelt’s gold program reports that economic historians generally view reflation as an important force in recovery.
Yet policy tightened too soon later in the decade. Federal spending fell, Social Security payroll taxes began, the Treasury sterilized gold inflows, and the Fed raised reserve requirements. Consequently, the 1937-1938 recession drove the deflator down 2.86% in 1938. According to the Federal Reserve’s 1937-1938 account, the episode warns against withdrawing support prematurely.
Subsequently, the recession weakened Roosevelt’s legislative position. Democrats suffered large losses in the 1938 midterms, while a conservative coalition gained influence in Congress. Therefore, deflation and renewed unemployment helped slow the New Deal’s expansion.
World War II changed the picture again. Defense mobilization increased demand and eliminated mass unemployment. At the same time, rationing and price controls limited measured inflation. The rate still reached 7.96% in 1942. Thus, Roosevelt’s moderate full-period average hides both a deflation battle and a controlled wartime economy.
Postwar Inflation, Korea, and Midcentury Stability
Harry S. Truman, 1945-1952
Truman’s assigned years averaged 5.24%, the fifth-highest result. The price level rose 49.45% cumulatively, second only to Wilson’s segment. Inflation reached 12.89% in 1946 and 10.97% in 1947 after wartime controls weakened or disappeared.
During the war, consumers had accumulated savings while rationing restricted purchases. Afterwards, households rushed to buy cars, appliances, housing, and food. Yet factories needed time to shift from military production. Consequently, demand met limited civilian supply.
The Federal Reserve’s postwar history explains that ending price controls in 1946 released suppressed inflation. Moreover, the Miller Center’s Truman analysis documents shortages, meat-price anger, strikes, and a sharp fall in presidential approval.
Those pressures had immediate political consequences. Republicans used the slogan “Had Enough?” and won both chambers of Congress in 1946. Although Truman staged a remarkable comeback in 1948, the new Congress restricted his domestic agenda and passed the Taft-Hartley Act over his veto.
Korean War mobilization then pushed inflation up again, especially in 1951. Truman restored wage and price controls and clashed with the Fed over low interest-rate pegs. Ultimately, the Treasury-Fed Accord of 1951 separated debt management from monetary policy. That institutional consequence shaped every later presidency because it strengthened central-bank independence.
Dwight D. Eisenhower, 1953-1960
Eisenhower’s assigned years averaged 1.95%, and cumulative prices rose 16.63%. Every year had inflation, but the rate stayed between 0.93% and 3.41%. Therefore, his record combined low inflation with the absence of outright deflation.
Several forces supported that result. The Korean War ended, defense pressure eased, productivity grew, and the postwar economy expanded. In addition, the newly independent Fed placed greater emphasis on price stability.
The Miller Center’s Eisenhower review describes strong growth, generally low unemployment, and inflation usually near 2% or below. Eisenhower also favored balanced budgets, although recessions occurred in 1953-1954, 1957-1958, and 1960.
Politically, stable prices and rising household income supported an image of calm competence. Eisenhower won reelection decisively in 1956, and the consumer economy expanded throughout the decade. However, recessions helped Democrats gain congressional seats, especially in 1958.
Consequently, low inflation strengthened the administration without insulating it from business cycles. This period remains a useful example of why price stability works best when paired with employment and growth.
John F. Kennedy, 1961-1963
Kennedy recorded the lowest positive average in the study, at 1.14%. Prices rose only 3.47% cumulatively across his three assigned years. The narrow annual range, from 1.06% to 1.21%, also indicates unusual price stability.
However, Kennedy inherited recession and elevated unemployment. Therefore, his main economic challenge involved faster growth rather than excessive inflation. According to the Miller Center’s domestic-policy account, tax, housing, unemployment, wage, and business measures aimed to stimulate demand.
Meanwhile, the administration also used voluntary wage-price guideposts. When major steel companies announced a price increase in 1962, Kennedy applied public and regulatory pressure until they withdrew it. The JFK Library’s economic-policy oral history documents the guideposts, the steel confrontation, and the administration’s concern about inflation.
Consequently, low inflation gave Kennedy room to pursue expansion. Still, the steel episode angered parts of the business community and revealed the political limits of informal price management. Moreover, the later Great Inflation showed that guideposts could not replace durable fiscal and monetary discipline.
U.S. Inflation by President During the Great Inflation
Lyndon B. Johnson, 1964-1968
Johnson’s assigned years averaged 2.66%, while prices rose 14.02% cumulatively. Those figures appear moderate beside the 1970s. Nevertheless, the annual rate accelerated from 1.52% in 1964 to 4.26% in 1968.
Vietnam War spending rose while Great Society programs expanded domestic demand. The 1964 tax cut also supported growth. However, Johnson resisted prompt fiscal restraint because he feared that Congress would cut social programs in exchange.
The Richmond Fed’s study of the 1965 clash between Johnson and Fed Chair William McChesney Martin explains the tension. Martin wanted higher rates as fiscal stimulus raised inflation risks, while Johnson feared tighter money would damage growth and the Great Society.
Congress eventually enacted a temporary income-tax surcharge in 1968. By then, inflation had already broadened. Moreover, expectations and accommodative monetary policy helped carry the problem into later administrations.
The economic consequence was a narrowing policy tradeoff. Johnson could no longer finance war, social expansion, and low taxes without pressure. Politically, inflation added to public unease, although Vietnam, civil unrest, and party division mattered far more to his 1968 withdrawal. Therefore, Johnson’s record marks the start of the Great Inflation, not its final peak.
Richard Nixon, 1969-1974
Nixon’s assigned years averaged 5.68%, and prices rose 39.18%. Inflation never fell below 4.33%, while it reached 9.00% in 1974. Thus, Nixon inherited an accelerating process and left an economy in stagflation.
At first, the administration used gradual monetary and fiscal restraint. Rising unemployment then created political pressure before the 1970 midterms. Consequently, Nixon shifted toward expansion and later imposed wage and price controls in August 1971.
The controls temporarily slowed visible inflation and supported the 1972 boom. However, they distorted production incentives, delayed price adjustments, and encouraged shortages. The Miller Center’s Nixon account explains how electoral concerns influenced the timing of economic decisions.
Nixon also ended dollar convertibility into gold for foreign official holders. That decision closed the Bretton Woods era. Meanwhile, expansive policy, food shortages, and the 1973 Arab oil embargo pushed inflation higher.
The Federal Reserve History overview of the Great Inflation concludes that controls only postponed inflation and worsened shortages. By 1974, the economy combined weak growth, rising unemployment, fuel lines, and high prices.
Watergate caused Nixon’s resignation, not inflation. Nevertheless, stagflation damaged public confidence and constrained every domestic option. It also handed Ford an economy in which fighting inflation risked deeper recession.
Gerald Ford, 1975-1976
Ford’s assigned years averaged 7.38%, the third-highest administration rate. Prices rose 15.28% in only two years. Inflation reached 9.26% in 1975 before slowing to 5.50% in 1976.
Ford inherited the first oil shock, price-control distortions, recession, and rising unemployment. Initially, he called inflation “public enemy number one.” His Whip Inflation Now campaign promoted voluntary thrift, while his first plan combined spending restraint with a tax increase.
The recession soon forced a pivot. Ford supported tax cuts to revive demand, while he fought Congress over federal spending. The Miller Center’s Ford analysis details the policy reversal and the difficulty of fighting inflation and unemployment at the same time.
Politically, the WIN campaign became a symbol of weak policy. Moreover, high prices reduced real purchasing power even as joblessness increased. This combination made voters feel worse from both directions.
Ford narrowly lost the 1976 election. Inflation and recession contributed to that defeat, but they were not the only factors. The Nixon pardon, Watergate’s legacy, party division, and campaign performance also mattered. Therefore, the economic record created a severe headwind rather than a complete explanation.
Jimmy Carter, 1977-1980
Carter had the second-highest average, at 7.64%. Cumulative prices rose 34.23%, and every assigned year exceeded 6%. The GDP-deflator rate reached 9.03% in 1980, while monthly CPI inflation rose even higher.
The administration inherited entrenched inflation expectations and limited policy credibility. Then the Iranian Revolution produced a second oil shock. Energy costs climbed, wage-price pressure persisted, and interest rates rose.
Carter tried spending restraint, voluntary wage-price standards, credit controls, conservation, and energy deregulation. He also appointed Paul Volcker to chair the Federal Reserve in 1979. The Miller Center’s Carter analysis notes that some energy reforms later increased supply and reduced costs, although voters saw little benefit during his term.
Volcker shifted the Fed toward strict control of money and reserves. Consequently, interest rates became highly volatile and the economy entered recession in 1980. Inflation did not disappear immediately because expectations and contracts adjusted slowly.
The political consequences were severe. High prices, borrowing costs, fuel disruptions, and unemployment weakened confidence. The hostage crisis, Soviet invasion of Afghanistan, and a divided Democratic Party compounded the problem. Therefore, inflation became a central reason voters rejected Carter, although it did not act alone.
Ronald Reagan, 1981-1988
Reagan’s assigned years averaged 4.29%, and cumulative prices rose 39.72%. At first, that total appears surprisingly high. However, inflation reached 9.46% in 1981 and 6.19% in 1982 before falling to 2.01% by 1986.
The early rates largely reflect an inherited process and the lagged effects of the second oil shock. Meanwhile, Volcker’s Fed continued aggressive monetary tightening. Reagan supported Volcker despite criticism from farmers, builders, labor leaders, and members of his own party.
The cost was a deep 1981-1982 recession. Unemployment approached 11%, industrial regions suffered, and Reagan’s approval fell. The Miller Center’s Reagan domestic-policy review connects the recession to tight Fed policy and notes the political strain it caused.
Disinflation then changed the administration’s fortunes. Lower inflation restored real purchasing power, reduced uncertainty, and eventually allowed interest rates to decline. In addition, economic growth accelerated after 1982.
Consequently, the same disinflation that hurt Reagan early helped him later. He won reelection in a 49-state landslide in 1984. Nevertheless, the administration also ran large deficits, while dollar appreciation and high rates pressured manufacturing and agriculture. The result was a successful inflation transition with substantial distributional costs.
Beyond that result, the broader legacy was institutional. Accordingly, the Federal Reserve History account argues that restored anti-inflation credibility helped lay the foundation for the Great Moderation.
U.S. Inflation by President During the Great Moderation
George H. W. Bush, 1989-1992
Bush’s assigned years averaged 3.33%, while prices rose 14.00% cumulatively. Inflation declined from 3.92% in 1989 to 2.28% in 1992. Therefore, inflation moved in the right direction even as the administration lost political support.
Oil prices rose around Iraq’s invasion of Kuwait and the Gulf War. At the same time, tight credit, the savings-and-loan crisis, and recession weakened the domestic economy. Consequently, lower inflation partly reflected softer demand rather than uncomplicated prosperity.
Bush also accepted a 1990 deficit agreement that raised taxes despite his “no new taxes” pledge. The Miller Center’s Bush domestic-policy account explains that the compromise angered conservatives. Meanwhile, many other voters believed he focused too little on the recession.
The Miller Center’s 1992 campaign history describes how economic frustration dominated the election. Clinton’s “It’s the economy, stupid” message proved effective, while Ross Perot challenged both parties.
Thus, falling inflation did not rescue Bush. Households cared about jobs, wages, and recovery as well as price stability. This episode shows that voters judge the whole economy, not one favorable indicator.
Bill Clinton, 1993-2000
Clinton’s assigned years averaged 1.87%, and cumulative prices rose 15.97%. Inflation remained between 1.12% and 2.37%. In addition, every year had positive but low broad-output inflation.
The result formed part of the Great Moderation. Better monetary policy mattered, but so did favorable supply conditions, productivity growth, cheaper imported goods, low commodity prices, and a shift toward services. The Federal Reserve History review of the Great Moderation identifies good policy, structural change, and good luck as leading explanations.
Clinton supported deficit reduction and reappointed Alan Greenspan as Fed chair. Meanwhile, technology investment and labor-force growth expanded productive capacity. Consequently, unemployment could fall without triggering a 1970s-style inflation spiral.
The political benefits were substantial. Low inflation, low unemployment, stronger growth, and falling deficits helped Clinton win reelection in 1996. Later, federal budgets moved into surplus. The Miller Center’s Clinton analysis connects low inflation and low interest rates to the era’s strong economy.
However, no president owns an independent central bank’s achievement or a global productivity cycle. Moreover, financial deregulation and rising asset valuations created risks that consumer-price data did not capture. Therefore, Clinton’s record was strong, but it was not solely presidential.
George W. Bush, 2001-2008
George W. Bush’s assigned years averaged 2.42%, and cumulative prices rose 21.03%. Inflation peaked at 3.13% in 2005 and fell to 1.88% in 2008. Yet the final-year decline did not signal a healthy economy.
The presidency began with a recession and the September 11 attacks. Immediately, the Federal Reserve’s 9/11 history explains, the central bank supplied liquidity and supported financial-market functioning. Consequently, the financial shock did not become a systemic collapse.
Later, housing, credit, energy, and commodity prices rose. Low interest rates, global capital flows, lax underwriting, complex securities, and weak supervision helped inflate a housing bubble. However, much of that risk appeared in asset prices and balance sheets rather than the GDP deflator.
When housing collapsed, financial institutions failed and demand plunged. Bush signed a fiscal stimulus in early 2008 and later supported TARP. The Miller Center’s account of the 2008 crisis describes the emergency shift toward large federal intervention.
Politically, the consequence was dramatic. That crisis overwhelmed other domestic issues, damaged Republican credibility, and shaped the 2008 election. Still, the 2008 deflator remained positive because an annual broad-output measure can miss sharp changes within the year. Therefore, low final-year inflation should not be confused with economic stability.
Low Inflation After the Great Recession
Barack Obama, 2009-2016
Obama’s assigned years averaged 1.38%, and cumulative prices rose 11.62%. The GDP deflator never recorded annual deflation, although the lowest rate was only 0.62% in 2009. CPI, by contrast, fell slightly on an annual-average basis that year.
Obama inherited a collapsing financial system, falling housing prices, and unemployment approaching 10%. The Federal Reserve History account of the Great Recession reports that real GDP fell 4.3% from peak to trough and unemployment doubled.
The administration used fiscal stimulus, auto-industry support, housing programs, and financial reform. Meanwhile, the Fed held rates near zero and purchased long-term securities. Those actions reduced depression risk, but recovery remained slow.
Low inflation created its own policy problem. When inflation runs below target, real interest rates can remain too high even when nominal rates approach zero. Moreover, weak pricing power can signal insufficient demand. Therefore, Obama’s low average was partly a symptom of economic slack.
Politically, the slow recovery and unpopular rescues fueled anger on both the left and right. Democrats suffered major losses in the 2010 midterms, while the Tea Party gained influence. Later, falling unemployment helped Obama win reelection in 2012. Consequently, low inflation offered stability but did not erase frustration over jobs, housing, wages, and inequality.
The Miller Center’s Obama review credits emergency policies with stabilizing the economy. Nevertheless, it also notes that many voters viewed the programs as bailouts for powerful institutions.
U.S. Inflation by President During COVID-19 and Its Aftermath
Donald Trump, first term, 2017-2020
Trump’s first-term years averaged 1.77%, while prices rose 7.26% cumulatively. Inflation peaked at 2.29% in 2018 and fell to 1.34% in 2020. Therefore, the pre-pandemic period remained broadly consistent with the low-inflation era.
Tax cuts and deregulation supported demand, while tariffs changed costs in selected sectors. Yet global competition, anchored expectations, productivity, and Fed policy kept overall inflation moderate. Consequently, the first three years did not produce a broad price surge.
COVID-19 then closed businesses, disrupted factories, changed consumption, and caused mass layoffs. Congress and Trump enacted the CARES Act, while the Fed cut rates and created emergency lending programs. Those measures protected incomes, credit, and financial stability during an extraordinary shock.
The immediate consequence was not high 2020 inflation. Demand for in-person services collapsed, oil prices fell, and the annual deflator slowed. However, households accumulated savings while production networks shrank. The Federal Reserve’s later estimate placed excess household savings at about $2.3 trillion by the third quarter of 2021, reflecting both limited spending opportunities and fiscal transfers from 2020 and 2021.
Politically, the pandemic dominated the 2020 election. The Miller Center’s election analysis calls COVID-19 the most important factor shaping that campaign. Thus, Trump’s first-term inflation average stayed low, while the health and employment crisis transformed his governing record.
Joe Biden, 2021-2024
Biden’s assigned years averaged 4.46%, while the price level rose 19.03%. Inflation climbed to 7.11% in 2022, then slowed to 3.70% in 2023 and 2.48% in 2024. Therefore, the administration contained both the sharpest modern surge in this series and a substantial later disinflation.
Several forces interacted. Reopening shifted demand faster than factories, ports, and labor supply could respond. Semiconductor shortages constrained vehicles and electronics. Energy and food prices rose after Russia invaded Ukraine. Rents adjusted with a lag, while a tight labor market supported wage growth.
Fiscal policy also strengthened demand. The 2020 CARES Act and December relief law had already supported balance sheets. Biden then signed the American Rescue Plan in March 2021. A San Francisco Fed study estimated that U.S. income transfers may have contributed about 3 percentage points to the rise in inflation by late 2021, although the estimate carries uncertainty.
No single explanation fits the full episode. The Federal Reserve’s June 2022 minutes cited pandemic-related supply-demand imbalances, higher energy prices, and broader price pressure. Moreover, inflation surged across many countries, which confirms the importance of global shocks.
The Fed responded with rapid interest-rate increases and balance-sheet reduction. Consequently, mortgages, auto loans, business credit, and other borrowing became more expensive. Inflation later slowed as supply recovered, energy pressure eased, fiscal support faded, and demand cooled.
However, disinflation did not reverse the price level. A 19.03% cumulative increase meant that household budgets remained much higher than in 2020. Thus, voters could hear that the inflation rate was falling while still facing expensive food, rent, insurance, and housing finance.
The political consequences were persistent. Biden’s economic approval remained weak, and affordability shaped legislative messaging around the Inflation Reduction Act, energy, competition, prescription drugs, and housing. In September 2024, Pew Research found that 81% of registered voters considered the economy very important to their presidential vote.
Ultimately, inflation damaged the governing party even after the rate declined. AP VoteCast reported that voters prioritizing inflation strongly favored Trump over Harris in 2024. Still, immigration, leadership perceptions, party loyalty, and other issues also shaped the result. Therefore, inflation was a major electoral force, not a complete explanation.
Donald Trump, second term through 2025
The second Trump segment contains one complete year. Specifically, the 2025 GDP-deflator rate was 2.83%, compared with 2.48% in 2024. Because only one observation exists, its average, compound rate, cumulative change, peak, and low all equal 2.83%.
Consumer inflation looked similar but not identical. The BLS 2025 review reported that CPI rose 2.7% from December 2024 to December 2025. Different coverage and timing explain the small gap.
Trade policy became a central inflation issue during 2025. Tariffs raise government revenue, but importers may pass part of the cost to wholesalers, businesses, and households. The Federal Reserve’s June 2025 Monetary Policy Report said higher tariffs were pushing up some consumer-goods prices, although the scale remained uncertain at that time.
Later evidence clarified part of the effect. A Federal Reserve study published in 2026 estimated that tariffs implemented through November 2025 raised core-goods PCE prices by 3.1% through February 2026. The authors estimated a 0.8% boost to core PCE prices overall.
Consequently, the administration faced a policy tradeoff. Tariffs could support strategic or revenue goals, but they also raised selected prices and complicated Fed decisions. Moreover, voters who expected rapid price declines could remain dissatisfied because slower inflation still leaves previous price increases in place.
Any historical ranking remains premature. The row covers 2025 only, while an administration lasts several years and policy effects arrive with lags. Therefore, readers should treat 2.83% as a completed annual observation, not a final verdict on the second term.
How Inflation and Deflation Change a Presidency
Inflation reduces real purchasing power unevenly
Inflation matters when wages, pensions, and benefits fail to keep pace. Households then buy less with the same nominal income. However, the burden differs across people because spending baskets differ.
Lower-income households often devote more income to food, rent, utilities, and transportation. Consequently, a surge in essentials can hurt them even when a broad index moderates. Homeowners with fixed-rate mortgages may gain from unexpected inflation, while renters and new borrowers can face higher costs.
Politically, these uneven effects complicate messaging. National averages can improve while visible prices remain painful. Therefore, an administration must explain both the inflation rate and the accumulated price level.
Deflation raises real debt and can deepen recession
Falling prices sound attractive, but broad deflation usually accompanies weak demand. Revenue falls, firms cut payrolls, and borrowers repay debts with more valuable dollars. As a result, defaults and bank losses can increase.
Hoover’s experience provides the clearest example. Prices fell rapidly while unemployment and bank failures rose. Likewise, Harding’s 1921 deflation imposed severe costs on farmers and debtors even though the economy recovered sooner.
Consequently, policymakers usually prefer low positive inflation to persistent deflation. The Fed’s 2% goal provides a cushion against economy-wide price declines and allows relative prices and wages to adjust more easily.
High inflation forces unpopular tradeoffs
An administration can reduce demand through taxes, spending restraint, or cooperation with tighter monetary policy. Yet those choices can slow growth and increase unemployment. Alternatively, it can tolerate inflation, but expectations may become entrenched.
Ford and Carter faced this dilemma during stagflation. Reagan then accepted the short-run costs of Volcker’s tightening. Accordingly, inflation policy often shifts pain through time instead of eliminating it immediately.
Price controls offer another temptation. Nixon’s controls produced short-term relief, but shortages and delayed adjustments followed. Therefore, controls can suppress measured prices without resolving excess demand or monetary pressure.
Inflation changes legislative priorities
High inflation narrows fiscal room because interest costs rise and voters resist new spending. It can also reshape legislation. Truman sought price controls, Ford emphasized restraint, Carter prioritized energy, and Biden promoted measures labeled around inflation and costs.
Deflation can produce the opposite response. Roosevelt expanded federal intervention to restore demand, repair banks, support incomes, and raise prices from destructive lows. Similarly, Obama used stimulus to prevent a deeper post-crisis contraction.
Thus, price conditions do not merely affect popularity. They change what a government can pass, how it explains policy, and which coalitions gain power.
Elections respond to the full economy
Inflation contributed to major political defeats in 1946, 1976, 1980, and 2024. Deflation and depression devastated incumbents in 1932. Conversely, disinflation and recovery helped Reagan in 1984, while stable growth helped Clinton in 1996.
Nevertheless, no election turns on one statistic. Wars, scandals, candidates, social conflict, party coalitions, and institutional events also matter. Moreover, voters care about unemployment and income growth alongside prices.
Therefore, the safest conclusion is probabilistic. Severe inflation or deflation raises political risk, constrains policy, and weakens trust. It does not mechanically determine the winner.
What the Presidential Ranking Does Not Show
It does not measure real wage growth
A 4% inflation rate can coincide with 6% wage growth, which raises average real pay. Conversely, 2% inflation can hurt if wages grow only 1%. Therefore, inflation alone cannot show whether living standards improved.
It does not show unemployment or output
Hoover’s deflation came with catastrophe, while Coolidge’s mild deflation accompanied expansion. Similarly, Carter’s inflation came with stagflation, whereas some wartime inflation coincided with full employment. Consequently, the same price rate can carry very different real outcomes.
It does not capture asset prices well
The GDP deflator tracks current production prices, not stock or existing-home values. Thus, Coolidge-era equities, the late-1990s technology boom, and the 2000s housing bubble require separate analysis.
It does not isolate presidential policy
Fed decisions can dominate inflation outcomes, especially after 1951. Congress controls appropriations and taxes. In addition, global supply, technology, demographics, exchange rates, and commodity markets affect prices.
As a result, this ranking should begin an investigation rather than end one. The best question is not only “Who was president?” It is also “What shocks arrived, what policies changed, and when could they reasonably affect prices?”
Key Findings From 126 Years of Data
| Finding | Result | Why it matters |
| Highest administration average | Wilson, 9.22% | World War I dominates the long-run ranking |
| Lowest administration average | Hoover, -6.32% | Deep deflation signals collapse, not success |
| Highest single year | 1917, 23.32% under Wilson | Wartime mobilization created extreme pressure |
| Deepest single year | 1921, -14.78% under Harding | Postwar tightening caused a historic reversal |
| Largest cumulative rise | Wilson, 98.34% | Broad prices nearly doubled across eight years |
| Largest cumulative fall | Hoover, -23.41% | Debt burdens rose as prices and incomes collapsed |
| Highest post-World War II average | Carter, 7.64% | Entrenched inflation and oil shocks defined the term |
| Lowest post-World War II positive average | Kennedy, 1.14% | Inflation remained unusually stable in 1961-1963 |
| Longest GDP-deflator inflation run | 1950-2025, 76 years | Broad annual deflation disappeared after 1949 |
| Most important ranking warning | Party mean and median disagree | Extreme eras dominate simple averages |
First, wartime and postwar adjustments produced larger swings than most modern readers expect. Second, deflation episodes were concentrated before 1950. Finally, the modern problem shifted from recurring price declines to controlling persistent positive inflation.
One additional curiosity concerns Reagan. His cumulative price increase slightly exceeded Nixon’s, although Reagan oversaw major disinflation. The reason is timing and term length. Reagan inherited very high rates, served eight assigned years, and then reduced inflation gradually.
Another surprise concerns Obama. CPI recorded slight annual-average deflation in 2009, but the GDP deflator stayed positive. Consequently, a statement about “deflation under Obama” can be true or false depending on the index.
The party table offers a final lesson. Democratic years have the higher arithmetic mean, while Republican years have the higher median. Therefore, a partisan claim can reverse when the statistic changes.
Frequently Asked Questions About U.S. Inflation by President
Which U.S. president had the highest average inflation?
Woodrow Wilson had the highest average annual GDP-deflator inflation in this 1900-2025 study. His assigned years averaged 9.22%. World War I mobilization, war finance, shortages, gold inflows, and postwar demand drove the result.
Which president had the most cumulative inflation?
Wilson also had the largest cumulative price increase. The GDP-deflator price level rose 98.34% across his assigned years, 1913-1920. In other words, broad domestic production prices almost doubled.
Which president had the highest postwar inflation?
Jimmy Carter had the highest post-World War II administration average, at 7.64%. Gerald Ford followed at 7.38%. However, both inherited the multi-administration Great Inflation and faced major oil shocks.
Which president had the worst deflation?
Herbert Hoover had the lowest administration average, at -6.32%. Cumulative prices fell 23.41% across 1929-1932. However, the deepest single annual decline was -14.78% in 1921 under Warren Harding.
Was deflation good under Hoover or Harding?
No. Broad, rapid deflation raised real debt burdens, weakened revenue, and accompanied unemployment and financial distress. Harding’s recession ended relatively quickly, but Hoover’s deflation became part of the Great Depression.
Which modern president had the lowest inflation?
Among presidents after World War II, John F. Kennedy had the lowest GDP-deflator average, at 1.14%. Barack Obama followed at 1.38%, while Donald Trump’s first term averaged 1.77%.
Why was inflation high under Carter?
Carter inherited entrenched inflation expectations and accommodative policy. In addition, the second oil shock raised energy costs. Wage-price persistence, weak credibility, and strong demand also mattered. Carter appointed Paul Volcker, whose later tightening helped end the episode at a high short-run cost.
Did Reagan reduce inflation?
Inflation fell sharply during Reagan’s presidency, but the Federal Reserve led the disinflation. Reagan supported Volcker despite the 1981-1982 recession. Therefore, the result combined Fed action, presidential political support, recession, oil-price changes, and shifting expectations.
Why was inflation low under Obama?
Weak demand, economic slack, slow recovery, global disinflation, and anchored expectations held inflation down. The Fed also struggled near the zero lower bound. Consequently, low inflation sometimes signaled insufficient demand rather than an ideal economy.
What caused inflation under Biden?
Pandemic supply constraints, reopening demand, fiscal support under both Trump and Biden, energy and food shocks, tight labor markets, housing lags, and accommodative early monetary policy all contributed. Therefore, no credible account assigns the episode to one law or one person.
What was inflation in Trump’s first term?
The GDP-deflator rate averaged 1.77% across 2017-2020, while cumulative prices rose 7.26%. Inflation remained moderate before COVID-19 and slowed during the 2020 shock.
What was inflation in Trump’s second term through 2025?
The 2025 annual GDP-deflator rate was 2.83%. CPI rose 2.7% from December 2024 to December 2025. However, one year cannot represent a full term, and later revisions may alter GDP data.
Do tariffs cause inflation?
Tariffs can raise prices for imported goods and domestic substitutes when businesses pass costs through. However, they can also weaken demand, alter exchange rates, or compress profit margins. Therefore, the final inflation effect depends on coverage, retaliation, monetary policy, and economic conditions.
Does the president control inflation?
No. A president influences fiscal, trade, energy, regulatory, and appointment decisions. However, Congress controls legislation, the Fed sets monetary policy independently, and global shocks affect supply. Presidents influence inflation, but they do not control it.
Why use the GDP deflator instead of CPI for this ranking?
The GDP deflator provides a broad measure of U.S.-produced final output and supports the project’s consistent 1900-2025 history. CPI better reflects an urban consumer basket. Consequently, readers should use CPI for household purchasing-power questions and the GDP deflator for this broad production-price comparison.
Can average inflation compare presidents of different term lengths?
Average and compound rates improve comparability, but they do not solve inherited conditions or policy lags. Cumulative change especially favors longer periods. Therefore, readers should compare the average, compound rate, peaks, lows, and historical context together.
Sources and Reproducibility
The numerical table uses two linked GDP-deflator segments:
- 1900-1928: Louis Johnston and Samuel H. Williamson historical estimates through MeasuringWorth.
- 1929-2025: U.S. Bureau of Economic Analysis NIPA Table 1.1.9 through BEA and FRED.
For each assigned year, the annual rate equals:
[
\text{Inflation}t = \left(\frac{D_t}{D{t-1}}-1\right)\times 100
]
Here, (D_t) represents the annual GDP deflator. The arithmetic mean averages the annual rates. Meanwhile, the compound annual rate uses the product of yearly price relatives. Cumulative change equals that product minus one.
All calculations use full-precision index values. Displayed percentages are rounded to two decimal places in summary tables and one decimal place in peak tables. Consequently, a reader who multiplies rounded rates may obtain a slightly different result.
The historical explanations rely primarily on the Bureau of Economic Analysis, Bureau of Labor Statistics, Federal Reserve Board, Federal Reserve History, regional Federal Reserve Banks, and the University of Virginia’s Miller Center. Political claims use cautious language because elections always have multiple causes.
Finally, BEA revises national accounts. The 2025 value represents the latest complete annual observation used for this publication. Future comprehensive revisions may change historical rates slightly.
Conclusion: What U.S. Inflation by President Really Teaches
U.S. inflation by president is most useful when it connects numbers to institutions and events. Wilson’s wartime record produced the highest average and largest cumulative increase. Hoover’s Depression record produced the deepest administration-wide deflation. Carter faced the highest postwar average, while Reagan’s early recession helped break the Great Inflation. More recently, pandemic supply shocks and extraordinary demand pushed inflation up under Biden before disinflation took hold.
Yet the central lesson concerns accountability with context. Presidents make choices that affect prices, and voters reasonably judge those choices. However, the Fed, Congress, wars, energy markets, supply networks, inherited conditions, and policy lags also shape every result.
Therefore, readers should avoid both extremes. A president deserves neither total credit for low inflation nor total blame for every price increase. The best analysis asks what the administration inherited, what shocks arrived, what policies it chose, and what consequences followed.
When those questions guide the comparison, the 1900-2025 record becomes more than a ranking. It becomes a history of how the United States learned to manage inflation, fear deflation, protect central-bank independence, and live with the political cost of changing prices.