

U.S. inflation rate history from 1900 to 2025 tells a much richer story than a single line on a chart. During those 126 years, two world wars nearly doubled broad domestic prices, the Great Depression produced four consecutive years of deflation, oil shocks fed the Great Inflation, and COVID-19 disrupted supply while extraordinary demand pushed prices sharply higher. Yet inflation also remained low and comparatively stable for long stretches, especially from the mid-1980s through 2019.
This article presents every annual observation from 1900 through 2025, from the oldest reconstructed data to the latest complete year available. It also separates three measures that people often mix together: the GDP price deflator, the Consumer Price Index, and the Personal Consumption Expenditures price index. That distinction matters because each index answers a different question.
For the long historical table, the article uses the annual percentage change in the implicit GDP price deflator. The pre-1929 estimates come from Louis Johnston and Samuel H. Williamson’s historical reconstruction, now maintained by MeasuringWorth. Starting in 1929, the series uses the official U.S. Bureau of Economic Analysis National Income and Product Accounts, which the Federal Reserve Bank of St. Louis also distributes through FRED series A191RD3A086NBEA.
However, the dollar-value questions use CPI-U because they ask about consumer purchasing power. As a result, the answers for $100 in 1990, $1 million in 1970, and $23,000 in 1985 come from the Bureau of Labor Statistics CPI rather than the GDP deflator.
U.S. Inflation Rate History at a Glance
The complete data reveal several striking facts. Most importantly, the most inflationary year in this series was 1917, not 1980 or 2022. Likewise, the sharpest deflation occurred in 1921, not during the Great Depression.
| Question | Answer | Measure |
|---|---|---|
| Years covered | 1900-2025 | Annual GDP deflator |
| Number of annual observations | 126 | Annual GDP deflator |
| Highest annual inflation | 23.3% in 1917 | Annual GDP deflator |
| Deepest annual deflation | -14.8% in 1921 | Annual GDP deflator |
| Longest deflation run | Four years, 1930-1933 | Annual GDP deflator |
| Longest uninterrupted inflation run | 76 years, 1950-2025 | Annual GDP deflator |
| Inflation years | 112 | Annual GDP deflator |
| Deflation years | 14 | Annual GDP deflator |
| Arithmetic mean annual rate | 2.9% | Annual GDP deflator |
| Median annual rate | 2.4% | Annual GDP deflator |
| Compound annual increase, 1900-2025 | 2.8% | Annual GDP deflator |
| Cumulative price-level increase | About 3,156% | GDP deflator, 1899 base to 2025 |
| Best-known modern CPI peak | 9.1% in June 2022, year over year | CPI-U |
| Latest complete annual CPI rate | 2.6% in 2025 | CPI-U annual average |
| Latest monthly CPI rate available at publication | 3.4% in July 2026, year over year | CPI-U, latest available reading |
Therefore, the historical record gives two immediate lessons. First, war, shortages, policy choices, and demand can interact in very different ways. Second, the answer changes when a researcher changes the price index, time frequency, or comparison method.
How the U.S. Annual Inflation Data Are Measured
The main 1900-2025 series uses the GDP price deflator
The GDP price deflator measures the prices of final goods and services produced in the United States. Consequently, it includes exports because the United States produces them, while it excludes imports because other countries produce them. The BEA’s definition also explains why the deflator provides a broad view of domestic production instead of a household shopping basket.
For annual data, use this inflation formula:
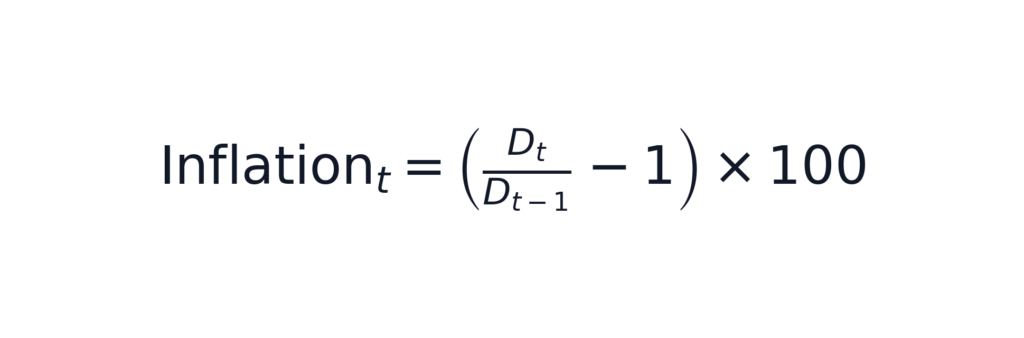
[\text{Inflation}t = \left(\frac{D_t}{D{t-1}}-1\right)\times 100]
Here, (D_t) is the annual-average GDP deflator in year (t). For example, the 2025 deflator was 128.979, compared with 125.428 in 2024. Therefore, the 2025 rate was approximately 2.8%.
Before 1929, no current BEA annual series exists. Instead, the historical segment links the Johnston-Williamson reconstruction to the modern BEA series at 1929. MeasuringWorth explains both the underlying historical work and its connection to official national accounts in its U.S. GDP data documentation. Accordingly, readers should treat 1900-1928 as careful historical estimates rather than modern agency observations.
CPI-U measures consumer purchasing power
The Consumer Price Index tracks the average change over time in prices paid by urban consumers for a market basket of goods and services. Thus, CPI-U is the more natural index for cost-of-living questions such as “What would $100 from 1990 buy today?” The BLS CPI overview describes the basket, population coverage, and publication schedule.
Moreover, CPI can appear in several valid forms. An annual-average change compares one calendar year’s average index with the previous year’s average. By contrast, a December-to-December rate compares two specific months. A monthly headline usually compares the latest month with the same month one year earlier. Since those calculations use different endpoints, they do not have to match.
The Federal Reserve targets PCE inflation
The Federal Reserve’s 2% longer-run goal refers to the Personal Consumption Expenditures price index, not the GDP deflator and not CPI. Its inflation FAQ identifies PCE as the target measure, while the BEA PCE page explains the index. In addition, the Fed reviews several price measures because no single index captures every dimension of inflation.
| Measure | Main question | Coverage | Imports | Typical use in this article |
| GDP price deflator | How did prices of U.S.-produced final output change? | All final domestic production | Excluded | Main 1900-2025 annual history |
| CPI-U | How did prices paid by urban consumers change? | Consumer market basket | Included when consumers buy them | Purchasing-power calculations and recent-period averages |
| PCE price index | How did prices of household consumption change? | Consumer spending, including some indirect purchases | Included | Federal Reserve policy context |
| Core CPI or core PCE | What does inflation look like without food and energy? | Respective index minus those volatile groups | Depends on parent index | Underlying-trend discussion |
| Median CPI or trimmed mean | What happens after reducing extreme component moves? | Distribution-based subset of CPI or PCE components | Depends on method | Inflation breadth and persistence |
For example, the Cleveland Fed’s inflation charting tools compare headline, core, median, and trimmed-mean measures. Consequently, analysts can distinguish a narrow energy shock from broad, persistent inflation.
Complete U.S. Annual Inflation Table, 1900-2025
The following U.S. inflation rate history table reports the annual percentage change in the GDP deflator. Values are rounded to one decimal place, so calculations based on the displayed numbers may differ slightly from calculations that use the full-precision index.
Historical data for 1900-1928: Johnston and Williamson GDP estimates via MeasuringWorth. Official data for 1929-2025: BEA NIPA Table 1.1.9 and FRED annual GDP deflator series.
1900-1924
| Year | GDP-deflator inflation | Historical context |
| 1900 | 2.9% | Pre-Federal Reserve expansion |
| 1901 | 2.8% | |
| 1902 | 2.8% | |
| 1903 | 4.7% | |
| 1904 | 2.7% | |
| 1905 | 0.7% | |
| 1906 | 3.6% | |
| 1907 | 6.3% | Panic of 1907 year |
| 1908 | -0.2% | Recession and mild deflation |
| 1909 | -1.4% | Deflation continues |
| 1910 | 2.6% | |
| 1911 | -0.5% | Mild deflation |
| 1912 | 4.0% | |
| 1913 | 0.7% | Federal Reserve Act enacted |
| 1914 | 0.9% | World War I begins in Europe |
| 1915 | 3.2% | War demand expands |
| 1916 | 12.7% | U.S. mobilization accelerates |
| 1917 | 23.3% | U.S. enters World War I; series peak |
| 1918 | 16.5% | War ends; shortages persist |
| 1919 | 2.5% | Demobilization and adjustment |
| 1920 | 13.9% | Postwar inflation surge |
| 1921 | -14.8% | Sharp postwar deflation; series trough |
| 1922 | -5.5% | Deflation continues |
| 1923 | 2.8% | Recovery |
| 1924 | -1.2% | Mild deflation |
1925-1949
| Year | GDP-deflator inflation | Historical context |
| 1925 | 1.8% | |
| 1926 | 0.5% | |
| 1927 | -2.4% | Deflation |
| 1928 | 0.8% | |
| 1929 | 0.3% | Wall Street crash; official BEA segment begins |
| 1930 | -3.7% | Great Depression deflation |
| 1931 | -10.3% | Banking crises intensify |
| 1932 | -11.7% | Deep Depression |
| 1933 | -2.8% | Bank holiday and reflation effort |
| 1934 | 5.5% | Reflation and recovery |
| 1935 | 2.1% | |
| 1936 | 1.2% | |
| 1937 | 4.3% | Recovery before the 1937-1938 recession |
| 1938 | -2.9% | Recession-era deflation |
| 1939 | -1.0% | Mild deflation |
| 1940 | 1.2% | Defense mobilization begins |
| 1941 | 6.8% | United States enters World War II |
| 1942 | 8.0% | Wartime controls and rationing |
| 1943 | 4.6% | Controls restrain measured prices |
| 1944 | 2.4% | Wartime controls continue |
| 1945 | 2.6% | World War II ends |
| 1946 | 12.9% | Price controls removed; inflation jumps |
| 1947 | 11.0% | Postwar inflation continues |
| 1948 | 5.6% | Inflation moderates |
| 1949 | -0.2% | Mild postwar deflation |
1950-1974
| Year | GDP-deflator inflation | Historical context |
| 1950 | 1.2% | Korean War begins |
| 1951 | 7.1% | Korean War inflation and Treasury-Fed Accord |
| 1952 | 1.7% | Inflation falls after controls and tightening |
| 1953 | 1.2% | Korean War armistice |
| 1954 | 0.9% | |
| 1955 | 1.7% | |
| 1956 | 3.4% | |
| 1957 | 3.3% | |
| 1958 | 2.3% | |
| 1959 | 1.4% | |
| 1960 | 1.4% | |
| 1961 | 1.1% | |
| 1962 | 1.2% | |
| 1963 | 1.1% | |
| 1964 | 1.5% | Last year before conventional Great Inflation dating |
| 1965 | 1.8% | Vietnam escalation and Great Inflation onset |
| 1966 | 2.8% | Demand pressure strengthens |
| 1967 | 2.9% | |
| 1968 | 4.3% | Fiscal pressure and accelerating prices |
| 1969 | 4.9% | |
| 1970 | 5.3% | Recession with persistent inflation |
| 1971 | 5.1% | Dollar-gold convertibility ends; controls begin |
| 1972 | 4.3% | Temporary moderation |
| 1973 | 5.5% | First oil shock begins |
| 1974 | 9.0% | Oil embargo inflation |
1975-1999
| Year | GDP-deflator inflation | Historical context |
| 1975 | 9.3% | Stagflation |
| 1976 | 5.5% | Inflation eases but stays high |
| 1977 | 6.2% | Reacceleration |
| 1978 | 7.0% | Broad inflation pressure |
| 1979 | 8.3% | Second oil shock |
| 1980 | 9.0% | Inflation crisis |
| 1981 | 9.5% | GDP-deflator peak of Great Inflation era |
| 1982 | 6.2% | Volcker disinflation and recession |
| 1983 | 3.9% | Disinflation advances |
| 1984 | 3.6% | Strong growth with lower inflation |
| 1985 | 3.2% | |
| 1986 | 2.0% | Oil-price decline aids disinflation |
| 1987 | 2.5% | Stock-market crash; inflation contained |
| 1988 | 3.5% | |
| 1989 | 3.9% | |
| 1990 | 3.7% | Oil shock and recession |
| 1991 | 3.4% | Gulf War; recession ends |
| 1992 | 2.3% | |
| 1993 | 2.4% | |
| 1994 | 2.1% | Monetary tightening cycle |
| 1995 | 2.1% | |
| 1996 | 1.8% | |
| 1997 | 1.7% | |
| 1998 | 1.1% | Asian crisis and low commodity prices |
| 1999 | 1.4% |
2000-2025
| Year | GDP-deflator inflation | Historical context |
| 2000 | 2.3% | Technology boom peaks |
| 2001 | 2.3% | Recession and September 11 attacks |
| 2002 | 1.6% | Low-inflation aftermath |
| 2003 | 2.0% | |
| 2004 | 2.7% | |
| 2005 | 3.1% | Energy and housing pressures |
| 2006 | 3.1% | |
| 2007 | 2.7% | Financial stress begins |
| 2008 | 1.9% | Financial crisis and commodity reversal |
| 2009 | 0.6% | Great Recession; GDP deflator stays positive |
| 2010 | 1.2% | Slow recovery |
| 2011 | 2.1% | Commodity-price pressure |
| 2012 | 1.9% | |
| 2013 | 1.7% | |
| 2014 | 1.7% | |
| 2015 | 0.9% | Oil prices fall |
| 2016 | 1.0% | |
| 2017 | 1.8% | GDP-deflator index reference year |
| 2018 | 2.3% | |
| 2019 | 1.7% | Pre-pandemic baseline |
| 2020 | 1.3% | COVID-19 shock |
| 2021 | 4.6% | Reopening, stimulus, and bottlenecks |
| 2022 | 7.1% | Post-COVID GDP-deflator peak; CPI averaged 8.0% |
| 2023 | 3.7% | Disinflation begins |
| 2024 | 2.5% | Further disinflation |
| 2025 | 2.8% | Latest complete annual GDP-deflator observation |
Highest U.S. Inflation and Deepest Deflation Years
The 12 highest annual inflation rates
World War I dominates the top of the ranking. In fact, three of the five highest rates occurred between 1916 and 1920. Meanwhile, the release of World War II price controls produced two more top-six observations.
| Rank | Year | GDP-deflator inflation | Main historical association |
| 1 | 1917 | 23.3% | World War I mobilization and scarcity |
| 2 | 1918 | 16.5% | Wartime demand and constrained supply |
| 3 | 1920 | 13.9% | Postwar demand, credit, and adjustment |
| 4 | 1946 | 12.9% | Removal of wartime price controls |
| 5 | 1916 | 12.7% | Export demand and mobilization |
| 6 | 1947 | 11.0% | Continued postwar repricing |
| 7 | 1981 | 9.5% | Great Inflation and second oil shock aftermath |
| 8 | 1975 | 9.3% | First oil shock and stagflation |
| 9 | 1980 | 9.0% | Oil shock, expectations, and wage-price persistence |
| 10 | 1974 | 9.0% | Arab oil embargo and broad cost pressure |
| 11 | 1979 | 8.3% | Iranian Revolution and second oil shock |
| 12 | 1942 | 8.0% | Early World War II mobilization |
Although CPI reached a 40-year year-over-year high of 9.1% in June 2022, the annual GDP-deflator rate for 2022 was 7.1%. The BLS release on the June 2022 CPI peak and the BEA annual deflator therefore describe the same inflation episode from different angles.
Every deflation year, ranked from deepest to mildest
Deflation means that the overall price index fell, not merely that inflation slowed. Thus, a decline from 7% inflation to 3% inflation is disinflation, while a rate below zero is deflation.
| Rank | Year | GDP-deflator change | Main historical association |
| 1 | 1921 | -14.8% | Post-World War I collapse and tight policy |
| 2 | 1932 | -11.7% | Deep Great Depression |
| 3 | 1931 | -10.3% | Bank failures, monetary contraction, weak demand |
| 4 | 1922 | -5.5% | Continued postwar adjustment |
| 5 | 1930 | -3.7% | Depression begins to deepen |
| 6 | 1938 | -2.9% | Recession of 1937-1938 |
| 7 | 1933 | -2.8% | Depression trough and transition to reflation |
| 8 | 1927 | -2.4% | Mild interwar deflation |
| 9 | 1909 | -1.4% | Post-Panic adjustment |
| 10 | 1924 | -1.2% | Mild interwar deflation |
| 11 | 1939 | -1.0% | Residual weakness before wartime mobilization |
| 12 | 1911 | -0.5% | Mild prewar deflation |
| 13 | 1908 | -0.2% | Recession after the Panic of 1907 |
| 14 | 1949 | -0.2% | Short postwar downturn |
The phrase “lowest inflation” can create confusion. If it means the most negative rate, the answer is -14.8% in 1921. However, if it means the lowest nonnegative rate, the answer is about 0.3% in 1929. In addition, the two rates closest to zero on the deflation side were -0.2% in 1949 and -0.2% in 1908.
Inflation by Decade: Average and Cumulative Change
The arithmetic average describes the typical annual rate within each period. In contrast, cumulative change shows how much the price level moved from the end of the year before the period through its final year. Because inflation compounds, multiplying the arithmetic average by the number of years does not produce the exact cumulative result.
| Period | Average annual rate | Compound annual rate | Cumulative price-level change |
| 1900-1909 | 2.5% | 2.5% | 27.5% |
| 1910-1919 | 6.6% | 6.3% | 84.9% |
| 1920-1929 | -0.4% | -0.6% | -6.0% |
| 1930-1939 | -1.9% | -2.1% | -18.9% |
| 1940-1949 | 5.5% | 5.4% | 69.2% |
| 1950-1959 | 2.4% | 2.4% | 26.9% |
| 1960-1969 | 2.3% | 2.3% | 25.4% |
| 1970-1979 | 6.5% | 6.5% | 88.3% |
| 1980-1989 | 4.7% | 4.7% | 58.3% |
| 1990-1999 | 2.2% | 2.2% | 24.4% |
| 2000-2009 | 2.2% | 2.2% | 24.5% |
| 2010-2019 | 1.6% | 1.6% | 17.4% |
| 2020-2025 | 3.7% | 3.7% | 24.0% |
Consequently, the 1910s produced the highest average inflation of any full decade in this series, narrowly exceeding the 1970s. The 1930s were the only full decade with sustained net deflation, while the 1920s also ended below their starting price level because the 1921-1922 collapse erased the 1920 surge.
The Economic History Behind U.S. Inflation, 1900-2025
1900-1913: business cycles before the modern Federal Reserve
At the start of the twentieth century, the United States operated under the classical gold standard and lacked a modern central bank. Inflation varied with harvests, credit conditions, gold flows, and industrial cycles. For instance, the series rose 6.3% in 1907, then slipped into mild deflation in 1908 and 1909 after the financial panic and recession.
That instability helped motivate monetary reform. Congress created the Federal Reserve System in 1913, although the new institution had little time to mature before World War I transformed finance and production. Meanwhile, the BLS began building a comprehensive cost-of-living index because wartime price changes made reliable consumer-price measurement urgent. The BLS history of the CPI documents that institutional development.
World War I: the largest annual inflation in the series
World War I created a classic combination of extraordinary demand and constrained civilian supply. European purchases boosted U.S. exports before American entry, and federal mobilization later redirected labor, metals, food, shipping, and credit toward the war. Therefore, GDP-deflator inflation rose from 3.2% in 1915 to 12.7% in 1916, 23.3% in 1917, and 16.5% in 1918.
Financing also mattered. The Treasury raised taxes, but it relied heavily on Liberty Bonds, while the Federal Reserve supported bond distribution and favorable financing conditions. According to the Federal Reserve History account of Liberty Bonds, bond financing totaled about $17 billion and taxes supplied $8.8 billion during the war. Likewise, the Federal Reserve’s role during World War I explains how the new central bank helped finance mobilization and later turned toward inflation control.
From 1914 through 1920, the GDP-deflator price level increased 96.9%, almost doubling in seven years. Its compound annual rate reached 10.2%. Consequently, World War I and its aftermath produced a larger cumulative surge than any modern peacetime episode of comparable length in this dataset.
The 1920-1921 reversal: the sharpest U.S. deflation
The postwar boom did not end gently. Inflation reached 13.9% in 1920, but the Federal Reserve sharply raised discount rates as officials tried to restrain prices and credit. At the same time, demobilization, inventory liquidation, falling commodity demand, and tighter financing hit output and employment.
As a result, the GDP deflator fell 14.8% in 1921, the deepest one-year decline in the entire 1900-2025 series. It dropped another 5.5% in 1922. Together, those two years reduced the price level by 19.4%. The Federal Reserve History overview of the Fed’s formative years connects the 1920 rate increase with the subsequent recession and price decline. In addition, the BLS long-run review finds that CPI fell by more than 20% from June 1920 through September 1922 in its monthly data.
The Great Depression: debt, bank failures, and a deflation spiral
The Great Depression produced the longest uninterrupted deflation run in the dataset. From 1930 through 1933, the GDP-deflator rates were -3.7%, -10.3%, -11.7%, and -2.8%. Overall, the price level fell 25.8% from 1929 to 1933.
Several forces reinforced one another. Bank failures destroyed deposits and disrupted credit. Falling spending reduced sales and employment. Moreover, the gold standard limited monetary flexibility and transmitted stress internationally. As prices and incomes fell, fixed nominal debts became harder to repay, which caused more defaults and further weakened banks.
The Federal Reserve History essay on the Great Depression reports that the U.S. money supply fell by nearly 30% from fall 1930 to winter 1933 and that average prices declined by a similar magnitude. Furthermore, the BLS century-long CPI review calculates a 27.4% consumer-price drop from October 1929 to April 1933.
Deflation amplified the downturn because wages and asset values could fall while the dollar amount of debt stayed fixed. Consequently, the real burden of mortgages, farm loans, and business debt rose. The Federal Reserve History discussion of the 1930-1931 banking panics describes this destructive feedback.
After Franklin D. Roosevelt took office, policy shifted toward reflation through banking stabilization, gold-policy changes, public spending, and other New Deal measures. Therefore, the deflator rose 5.5% in 1934. Nevertheless, recovery remained fragile, and the 1937-1938 recession pushed the deflator down 2.9% in 1938 and another 1.0% in 1939. The Federal Reserve History account of the 1937-1938 recession reports a 10% decline in real GDP and a 32% collapse in industrial production during that downturn.
World War II: mobilization, rationing, and suppressed inflation
World War II rapidly expanded federal spending, employment, industrial capacity, and household income. However, civilian goods became scarce because factories produced aircraft, ships, vehicles, weapons, and military supplies. That combination created enormous inflation pressure.
Measured GDP-deflator inflation climbed to 6.8% in 1941 and 8.0% in 1942. Then controls, rationing, war-bond drives, and consumer-credit restrictions limited recorded price increases. The Federal Reserve’s role during World War II explains how authorities used price and wage controls, rationing, and Regulation W to restrain demand. Meanwhile, BLS research on consumer spending during World War II shows that food prices had already risen about 11% from 1941 to the first quarter of 1942.
From 1941 through 1945, the GDP-deflator price level rose 26.6%, or about 4.8% per year. Yet controls suppressed some adjustments instead of eliminating the underlying pressure. Therefore, the end of controls exposed a large backlog of demand and repricing.
1946-1948: postwar controls end and inflation breaks out
Millions of service members returned home, factories switched back to civilian production, and households sought cars, appliances, housing, and other goods that had been scarce. Savings accumulated during the war strengthened demand. Meanwhile, supply needed time to convert and expand.
When the government removed major price controls in 1946, the GDP deflator jumped 12.9%. It then rose another 11.0% in 1947 and 5.6% in 1948. Thus, the price level increased 32.3% in only three years. The Federal Reserve History account of the World War II-to-Accord period describes how lifting controls released previously suppressed inflation.
This episode provides an important caution. Price controls can slow official price changes for a time, but shortages, queues, quality deterioration, and black markets may still reveal excess demand. Moreover, abrupt removal can concentrate the adjustment into a short period.
The Korean War: a short, intense consumer-price burst
North Korea invaded South Korea in June 1950. U.S. defense orders rose, consumers anticipated shortages, and businesses rebuilt inventories. Consequently, prices accelerated quickly, even though the annual GDP-deflator pattern looks less dramatic than the monthly CPI burst.
The deflator increased 7.1% in 1951, compared with 1.2% in 1950. Federal Reserve History reports that CPI inflation reached a 21% annualized pace by February 1951. The Treasury-Federal Reserve Accord history explains how the conflict intensified the dispute over the Fed’s obligation to keep government borrowing costs low.
Then, the March 1951 Accord restored greater monetary-policy independence and ended the wartime interest-rate peg. In addition, the government imposed controls and the initial panic buying faded. Therefore, GDP-deflator inflation fell to 1.7% in 1952 and 1.2% in 1953. Across 1950-1953, the deflator rose 11.6%, or 2.8% per year on a compound basis.
1952-1964: a long stretch of relative price stability
After the Korean War spike, inflation stayed comparatively moderate. The GDP-deflator rate averaged about 2% from the early 1950s through 1964, with no annual decline. Economic expansions, recessions, productivity gains, and monetary tightening all influenced individual years, yet the broad price level moved far more smoothly than it had from 1914 through 1951.
Federal Reserve History describes the period from the Treasury-Fed Accord to the mid-1960s as one of generally low and stable inflation. Nevertheless, that stability encouraged confidence that policymakers could push unemployment lower without creating persistent inflation, an assumption that later proved costly.
Vietnam, Great Society programs, and the start of the Great Inflation
The Great Inflation conventionally spans 1965-1982. At first, oil was not the main cause. Instead, the federal government expanded Vietnam War spending and Great Society programs while the economy operated near capacity. Tax policy also supported demand, and monetary policy did not fully offset the fiscal impulse.
Accordingly, GDP-deflator inflation rose from 1.5% in 1964 to 4.3% in 1968, 4.9% in 1969, and 5.3% in 1970. The Richmond Fed’s discussion of monetary policy and Vietnam-era fiscal expansion reviews contemporary warnings about the inflationary mix. Similarly, the BLS long-run history attributes the late-1960s acceleration to strong military and domestic spending, tax cuts, deficits, and demand that exceeded productive capacity.
In 1971, President Richard Nixon ended dollar convertibility into gold and imposed temporary wage and price controls. Although those controls briefly slowed measured inflation, they did not resolve the underlying imbalance. The Federal Reserve History account of the end of gold convertibility places those actions in the broader breakdown of the Bretton Woods system.
The first oil price shock, 1973-1974
In 1973, the first oil shock turned an existing inflation problem into stagflation. After the Arab-Israeli War in October, Arab members of OPEC imposed an embargo against the United States and other countries. Oil prices then rose from about $2.90 per barrel before the embargo to $11.65 by January 1974, according to the Federal Reserve History account of the 1973-1974 oil shock.
Energy affected transportation, heating, electricity, agriculture, plastics, and industrial production. Consequently, businesses faced higher costs while consumers lost purchasing power. GDP-deflator inflation reached 9.0% in 1974 and 9.3% in 1975. Over the 1973-1975 window, the broad domestic price level rose 25.6%.
Yet oil alone cannot explain the entire episode. Inflation had already accelerated before the embargo, expectations had become less anchored, and wage-price dynamics had gained momentum. Therefore, the shock magnified a vulnerable starting position.
The second oil price shock, 1978-1980
The Iranian Revolution disrupted oil supply in 1978-1979, and the Iran-Iraq War created further pressure in 1980. According to Federal Reserve History, oil prices more than doubled between April 1979 and April 1980.
This time, the economy already carried years of high inflation and unstable expectations. As a result, the deflator rose 8.3% in 1979, 9.0% in 1980, and 9.5% in 1981. From 1978 through 1981, the price level increased 38.3%, which translates to an 8.5% compound annual pace.
The BLS century review provides a vivid consumer example: gasoline prices roughly quadrupled from 1968 to their 1981 peak of about $1.39 per gallon. Although that nominal price looks low today, incomes and the overall price level were also much lower.
Volcker disinflation and the 1981-1982 recession
Paul Volcker became Federal Reserve chair in August 1979 and placed inflation control at the center of policy. The Fed restricted reserve growth, allowed interest rates to rise sharply, and tolerated a severe recession to break inflation expectations. Consequently, borrowing, housing, manufacturing, and employment weakened.
The strategy imposed a large short-run cost. Nevertheless, it changed the inflation regime. GDP-deflator inflation declined from 9.5% in 1981 to 6.2% in 1982, 3.9% in 1983, and 2.0% in 1986. The Federal Reserve History account of the 1981-1982 recession connects the downturn to the anti-inflation campaign and the effort to restore credibility.
Disinflation did not mean that prices returned to their 1970 level. Instead, the price level kept rising at a slower rate. This distinction remains essential: lower inflation reduces the speed of price increases, while deflation actually lowers the aggregate price index.
The Great Moderation, mid-1980s to 2007
From the mid-1980s through 2007, inflation and economic volatility generally declined. Better-anchored expectations, more credible monetary policy, structural changes, global supply integration, and some good luck all contributed. Economists call much of this period the Great Moderation.
GDP-deflator inflation averaged about 2.2% in both the 1990s and the 2000-2009 decade, although the financial crisis lowered the later decade’s endpoint. The Federal Reserve History essay on the Great Moderation summarizes competing explanations for the decline in macroeconomic volatility.
Still, stable consumer prices did not eliminate asset booms, financial leverage, or regional shocks. The 1987 stock-market crash, the 1990 oil shock and recession, the Asian financial crisis, and the technology bust all occurred within this broad low-inflation regime.
September 11, 2001: a liquidity and activity shock, not an inflation outbreak
On September 11, the attacks closed markets, damaged communications, disrupted travel, and created severe payment-system stress. In response, the Federal Reserve supplied liquidity, lent through the discount window, and reassured markets. Federal Reserve History reports that discount-window credit rose from less than $1 billion to about $46 billion on September 12, while Federal Reserve float surged from a $766 million daily average to $28 billion.
However, 9/11 did not produce a broad inflation surge. GDP-deflator inflation measured 2.3% in 2001 and 1.6% in 2002. Moreover, the National Bureau of Economic Research dates the recession’s start to March 2001, six months before the attacks. The recession ended in November 2001, according to the NBER trough announcement.
Therefore, analysts should describe 9/11 primarily as an immediate human tragedy, financial plumbing emergency, and negative activity shock. Its price effects varied by sector, but it did not resemble the broad wartime inflations of 1917 or 1946.
The Great Recession: CPI deflation without GDP-deflator deflation
The housing bust and financial crisis produced the deepest U.S. downturn since the 1930s at that time. Real GDP fell 4.3% from peak to trough, and unemployment rose to 10%, according to Federal Reserve History’s Great Recession overview.
Commodity prices also reversed sharply. As a result, annual-average CPI fell 0.4% in 2009. Yet the GDP deflator still increased 0.6% because it covers a different set of prices and uses different weights. This contrast offers a concrete reason not to paste CPI and GDP-deflator observations into one unlabeled series.
Across 2008-2010, the GDP-deflator price level increased only 3.8%, or 1.3% per year. Subsequently, the 2010s recorded the lowest positive full-decade average in the dataset, just 1.6%.
COVID-19: shutdown, reopening, stimulus, bottlenecks, and commodity shocks
COVID-19 first caused an abrupt collapse in mobility and demand for many services. At the same time, factories, ports, logistics networks, and workplaces faced shutdowns and health constraints. For example, BLS recorded a 16.5% seasonally adjusted drop in gasoline CPI in April 2020, as discussed in its pandemic seasonal-adjustment review.
However, the recovery changed the pressure quickly. Fiscal transfers, enhanced unemployment benefits, low interest rates, accumulated savings, and limited service consumption supported household demand. Consumers shifted spending toward goods, while semiconductor shortages, shipping delays, port congestion, and labor constraints limited supply. Consequently, prices for vehicles, furniture, appliances, freight, and many inputs rose sharply.
Research does not assign one universally accepted percentage to each cause. Nevertheless, the evidence supports a multi-cause explanation. A Federal Reserve note on fiscal policy and excess inflation offers an illustrative estimate that U.S. fiscal support contributed about 2.5 percentage points to inflation, while noting important limitations. Separately, a San Francisco Fed study estimates that global supply-chain pressures accounted for about 60% of the run-up that began in early 2021.
Russia’s 2022 invasion of Ukraine then added pressure to global energy, food, fertilizer, and commodity markets. The Federal Reserve’s June 2022 Monetary Policy Report highlighted those effects alongside continuing supply constraints and strong demand.
Accordingly, GDP-deflator inflation rose from 1.3% in 2020 to 4.6% in 2021 and 7.1% in 2022. CPI-U increased 8.0% on an annual-average basis in 2022 and reached 9.1% year over year in June. From 2020 through 2025, the GDP-deflator price level rose 24.0%, or 3.7% per year.
The Federal Reserve began raising its target rate in March 2022 and tightened substantially through July 2023. Meanwhile, supply chains healed, goods demand normalized, labor supply improved, and commodity pressure eased. Therefore, GDP-deflator inflation slowed to 3.7% in 2023 and 2.5% in 2024 before edging up to 2.8% in 2025.
2025: the latest complete year in the historical series
The annual GDP deflator reached 128.979 in 2025, up from 125.428 in 2024. Thus, broad prices for domestically produced final output increased 2.8%. CPI-U, by contrast, increased 2.6% on an annual-average basis, according to the BLS annual historical CPI table.
One technical caveat affects the 2025 CPI annual average. The federal funding lapse prevented BLS from publishing the October 2025 CPI observation, so the agency’s published annual average uses the available months. Consequently, researchers should preserve the BLS value and disclose the missing October observation rather than silently inventing it.
U.S. Inflation Rate in the Last 5, 10, 20, and 30 Years
Searches for the “average inflation rate last 5 years” often fail to define the index or averaging method. The table below uses CPI-U annual averages through 2025 because that measure best fits household purchasing power. It reports both the arithmetic mean of annual inflation rates and the compound annual rate calculated from CPI index levels.
| Window | CPI years included | Average annual CPI rate | Compound annual rate | Cumulative CPI increase |
| Last 5 complete years | 2021-2025 | 4.46% | 4.46% | 24.39% |
| Last 10 complete years | 2016-2025 | 3.11% | 3.11% | 35.83% |
| Last 20 complete years | 2006-2025 | 2.54% | 2.53% | 64.85% |
| Last 30 complete years | 1996-2025 | 2.53% | 2.52% | 111.25% |
Sources: BLS CPI data, Minneapolis Fed CPI history, and FRED CPI-U index.
The last five-year average remains high because it contains the 2021-2022 inflation surge. However, the 20-year and 30-year compound rates both sit near 2.5%. Therefore, a long-term purchasing-power calculation should use compounding and actual index levels rather than multiplying one recent rate by many years.
U.S. inflation rate over the last 10 complete years
| Year | Annual-average CPI inflation |
| 2016 | 1.3% |
| 2017 | 2.1% |
| 2018 | 2.4% |
| 2019 | 1.8% |
| 2020 | 1.2% |
| 2021 | 4.7% |
| 2022 | 8.0% |
| 2023 | 4.1% |
| 2024 | 2.9% |
| 2025 | 2.6% |
The simple average is 3.11%, while cumulative consumer inflation is 35.83%. In practical terms, a CPI basket costing $100 on average in 2015 cost about $135.83 on average in 2025.
U.S. Inflation Calculator: Answers to the Dollar-Value Questions
The screenshots ask three purchasing-power questions. Each calculation uses the CPI ratio method published by the Minneapolis Fed inflation calculator and supported by the BLS inflation calculator:
[
\text{Equivalent amount}=\text{Original amount}\times\frac{\text{Later CPI}}{\text{Earlier CPI}}
]
Because “today” changes each month, the table gives two answers. The first uses 2025’s annual-average CPI of 321.943, which matches the article’s completed-year boundary. Meanwhile, the second uses the latest available July 2026 CPI-U index of 333.918, as reported in the BLS historical U.S. CPI table.
| Question | In 2025 annual-average dollars | Using July 2026 CPI | Price multiple to July 2026 |
| How much is $100 in 1990 worth today? | $246.32 | $255.48 | 2.55 times |
| How much is $1,000,000 in 1970 worth today? | $8,297,500 | $8,606,134 | 8.61 times |
| How much is $23,000 in 1985 worth today? | $68,816.81 | $71,376.52 | 3.10 times |
How much is $100 in 1990 worth today?
$100 in 1990 had the same CPI-measured purchasing power as about $246.32 in 2025. Using the latest July 2026 index, it equals about $255.48. Therefore, the consumer price level more than doubled over the period.
For 2025, the calculation is $100 × (321.943 ÷ 130.7). Using July 2026, the calculation is $100 × (333.918 ÷ 130.7).
What is the inflation rate in the last 10 years?
For the ten complete years from 2016 through 2025, annual-average CPI inflation averaged 3.11% per year. Cumulatively, consumer prices increased 35.83% from the 2015 annual average to the 2025 annual average. Therefore, both figures are correct, but they answer different questions.
How much is $1,000,000 in 1970 worth today?
$1,000,000 in 1970 had the same CPI-measured purchasing power as about $8,297,500 in 2025. Using July 2026 CPI, the equivalent is approximately $8,606,134.
Although the nominal increase looks enormous, the calculation does not imply an investment return. Instead, it estimates how many current dollars would purchase a comparable consumer basket.
How much is $23,000 in 1985 worth today?
$23,000 in 1985 had the same CPI-measured purchasing power as about $68,816.81 in 2025. Using July 2026 CPI, the equivalent rises to approximately $71,376.52.
Again, the result describes average consumer prices. A specific household’s experience can differ because housing, medical care, education, fuel, food, taxes, and local costs do not all move at the same rate.
U.S. Inflation 2026: What the Latest Data Say
The 1900-2025 table stops at 2025 because 2026 is not yet a complete calendar year. Nevertheless, the latest monthly CPI release provides a current snapshot.
As of July 2026, headline CPI-U was 3.4% higher than a year earlier and 0.1% higher than the previous month on a seasonally adjusted basis. Core CPI, which excludes food and energy, increased 2.5% year over year. Meanwhile, energy prices rose 14.7%, food prices rose 3.0%, and shelter rose 3.2%. Source: BLS Consumer Price Index news release.
| July 2026 measure | Rate |
| Headline CPI, month over month, seasonally adjusted | 0.1% |
| Headline CPI, year over year | 3.4% |
| Core CPI, year over year | 2.5% |
| Food, year over year | 3.0% |
| Energy, year over year | 14.7% |
| Shelter, year over year | 3.2% |
However, 3.4% is not the “2026 annual inflation rate.” It compares July 2026 with July 2025. The completed annual-average rate will become available only after the year ends and BLS publishes the necessary data. Likewise, quarterly annualized GDP-deflator changes should not be inserted into an annual-average history table because the frequency and calculation differ.
U.S. Inflation Rate by Month: How to Read the Headlines
Monthly inflation stories typically report three numbers. First, the seasonally adjusted month-over-month change measures recent momentum. Second, the year-over-year change compares the latest month with the same month one year earlier. Third, core inflation removes food and energy to reduce volatility.
These values can move in different directions. For example, a modest monthly increase can coexist with a higher year-over-year rate if an unusually low month drops out of the 12-month comparison. Conversely, a high monthly reading may not immediately raise the 12-month rate if the prior-year comparison was also high.
For official monthly data, use the BLS CPI news release or BLS data series. FRED also provides the monthly all-items CPI-U index. Therefore, a current article should always state the reference month, adjustment status, comparison period, and index.
Why Inflation and Deflation Matter
Inflation changes purchasing power and contracts
Inflation reduces how much a fixed number of dollars can buy. Consequently, households need higher nominal income to maintain the same average consumption. Businesses also need to update prices, wages, budgets, inventories, and long-term contracts.
However, moderate, predictable inflation differs from volatile inflation. Stable inflation allows people to plan, while large surprises redistribute wealth between borrowers and lenders and distort price signals. For example, unexpected inflation reduces the real value of fixed-rate debt, while unexpected deflation increases it.
Deflation can deepen a debt crisis
Falling prices may sound beneficial to consumers, but broad deflation often accompanies severe recessions. If nominal incomes and asset prices fall while debts remain fixed, real debt burdens rise. Moreover, consumers may delay purchases if they expect lower prices, and businesses may cut investment because revenues decline.
The Great Depression illustrates that danger. That 25.8% GDP-deflator decline from 1929 to 1933 raised real debt burdens while banking failures restricted credit. Therefore, policymakers usually fear a sustained deflation spiral even when a brief decline in one category helps consumers.
Disinflation is not deflation
Disinflation means that prices still rise, but at a slower rate. Thus, the decline from 7.1% GDP-deflator inflation in 2022 to 3.7% in 2023 was disinflation. Prices did not return to their 2021 level.
This distinction explains why people may still feel that goods are expensive after the inflation rate falls. Lower inflation slows future increases; it does not normally reverse past increases.
Curiosities and Surprising Facts About U.S. Inflation
- 1917 outranks 1980 and 2022. The GDP deflator rose 23.3% in 1917, the highest annual rate in the entire series.
- Surprisingly, the largest deflation did not occur during the Great Depression. Instead, 1921 holds the record at -14.8%.
- World War I nearly doubled the broad price level. From 1914 through 1920, the GDP deflator increased 96.9%.
- The Great Depression erased more than one-quarter of the price level. From 1929 through 1933, the deflator fell 25.8%.
- Controls shifted some World War II inflation into the postwar years. After controls ended, prices rose 32.3% from 1946 through 1948.
- The 1910s narrowly beat the 1970s. Their average GDP-deflator inflation rates were 6.6% and 6.5%, respectively.
- The 1930s were the only full decade with deep net deflation. Across the decade, the price level fell 18.9%.
- The United States has not recorded annual GDP-deflator deflation since 1949. By 2025, the uninterrupted inflation run had reached 76 years.
- CPI and the GDP deflator disagreed in 2009. Annual-average CPI fell 0.4%, but the GDP deflator rose 0.6%.
- 9/11 was not a broad inflation shock. GDP-deflator inflation stayed at 2.3% in 2001 and slowed to 1.6% in 2002.
- The 2010s had the lowest positive decade average. GDP-deflator inflation averaged only 1.6% from 2010 through 2019.
- The COVID-era price-level change exceeded the annual rates many people remember. Although the largest annual GDP-deflator rate was 7.1%, the cumulative increase from 2020 through 2025 reached 24.0%.
- A 2.8% compound rate becomes enormous over 126 years. The GDP-deflator price level increased about 3,156% from the 1899 base through 2025.
- Annual averages can hide monthly peaks. CPI averaged 8.0% in 2022, yet its year-over-year rate reached 9.1% in June.
- The Federal Reserve does not target CPI. Its 2% goal uses PCE inflation, even though CPI dominates many headlines.
How to Use the U.S. Inflation Data Correctly
Match the index to the question
Use CPI when the question concerns household purchasing power, wages, rent escalation, or a consumer budget. Conversely, use the GDP deflator when the question concerns prices across domestically produced final output. Use PCE when discussing the Federal Reserve’s inflation objective.
Match the frequency and comparison
An annual-average rate, a December-to-December rate, and a July-to-July rate are all valid, but they are not interchangeable. Therefore, label the time basis beside every number. Also, do not mix a quarterly annualized change with an annual-average series.
Use index levels for long conversions
For a purchasing-power calculation, divide the later CPI level by the earlier CPI level. Do not multiply the original amount by one recent inflation rate for every year. Compounding and changing annual rates make that shortcut unreliable.
Separate historical estimates from official observations
The 1900-1928 GDP-deflator values rely on historical reconstruction. Starting in 1929, official BEA data take over. Accordingly, long-run comparisons should acknowledge greater uncertainty in the earliest segment.
Avoid false precision
Historical estimates, revisions, changing baskets, and index methodology all limit precision. Therefore, one decimal place is usually appropriate for annual rates, while currency conversions can show cents for reproducibility but should not imply that every household experienced the exact result.
Recheck current data before publication
Agencies revise some series, and a new monthly CPI release arrives frequently. Consequently, an editor should verify the reference month, source page, and release date immediately before publishing a “current inflation” claim.
Frequently Asked Questions About U.S. Inflation
What is the U.S. inflation rate history chart based on?
The chart-ready annual table in this article uses the percentage change in the GDP price deflator. Its 1900-1928 portion comes from the Johnston-Williamson historical reconstruction, while 1929-2025 comes from BEA NIPA Table 1.1.9. Therefore, it represents broad U.S. domestic-output prices, not a stitched CPI series.
What was the highest U.S. inflation rate between 1900 and 2025?
The highest annual GDP-deflator inflation rate was 23.3% in 1917. World War I mobilization, scarce civilian supply, export demand, and war finance drove the increase.
What was the worst U.S. deflation year?
The deepest annual GDP-deflator decline was -14.8% in 1921. That reversal followed the World War I and postwar inflation boom, tighter monetary policy, inventory liquidation, and falling commodity demand.
What happened to inflation during the Great Depression?
The GDP deflator fell in every year from 1930 through 1933. Cumulatively, the price level declined 25.8% from 1929 to 1933. Bank failures, monetary contraction, weak demand, the gold standard, and rising real debt burdens reinforced the collapse.
What happened to inflation during World War II?
GDP-deflator inflation reached 6.8% in 1941 and 8.0% in 1942. Controls and rationing then restrained measured increases, but inflation surged to 12.9% in 1946 and 11.0% in 1947 after controls ended.
Did the Korean War cause inflation?
Yes, particularly at the start of the conflict. GDP-deflator inflation reached 7.1% in 1951, while monthly consumer-price data showed an even sharper temporary burst. Controls, fading panic buying, tighter policy, and the Treasury-Fed Accord then helped inflation fall.
How did the Vietnam War affect inflation?
Vietnam War spending combined with Great Society programs, tax policy, strong demand, and accommodative monetary conditions. As a result, inflation accelerated before the 1973 oil shock. The war did not act alone, but it formed an important part of the Great Inflation’s demand-side origin.
What caused the first oil price shock?
In October 1973, the Arab-Israeli War and subsequent Arab oil embargo sharply reduced supplies to targeted countries. Oil prices nearly quadrupled, which raised costs across transport, industry, agriculture, and household energy.
What caused the second oil price shock?
The Iranian Revolution disrupted production, while the Iran-Iraq War added further uncertainty. Oil prices more than doubled from April 1979 to April 1980, and already elevated inflation expectations amplified the effect.
Did September 11 cause U.S. inflation?
No broad inflation outbreak followed 9/11. The attacks created financial-system, transportation, confidence, and activity shocks, but GDP-deflator inflation remained 2.3% in 2001 and slowed to 1.6% in 2002.
What caused the COVID inflation surge?
Several forces interacted: a rapid shift toward goods, fiscal support, easy financial conditions, accumulated savings, supply-chain bottlenecks, labor constraints, housing pressure, and later food and energy shocks after Russia invaded Ukraine. Therefore, no single explanation captures the entire episode.
What is the average U.S. inflation rate over the last 5 years?
Annual-average CPI inflation averaged 4.46% from 2021 through 2025. Cumulatively, CPI rose 24.39% from the 2020 annual average through the 2025 annual average.
What is the average U.S. inflation rate over the last 20 years?
Annual-average CPI inflation averaged 2.54% from 2006 through 2025. The compound annual rate was 2.53%, and cumulative inflation was 64.85%.
What is the average U.S. inflation rate over the last 30 years?
Annual-average CPI inflation averaged 2.53% from 1996 through 2025. The compound annual rate was 2.52%, while the cumulative CPI increase reached 111.25%.
What is the U.S. inflation rate in 2026?
No complete annual 2026 rate exists yet. The latest monthly reading at publication was 3.4% year over year in July 2026, while core CPI was 2.5%. Always identify the month when quoting an incomplete-year inflation rate.
Why does one website show a different annual inflation rate?
The site may use CPI instead of the GDP deflator, December-to-December instead of annual-average data, a different vintage, or a rounded value. Accordingly, compare the index, frequency, seasonal adjustment, endpoints, and release date before deciding that one value is wrong.
Sources, Reliability, and Methodology
Primary source hierarchy
This article prioritizes official U.S. government and Federal Reserve sources. Specifically, BEA supplies the official GDP deflator from 1929 onward, BLS supplies CPI, and Federal Reserve publications provide monetary-policy history. MeasuringWorth supplies the pre-1929 reconstruction because the official BEA annual series does not extend that far.
| Data or claim | Preferred source | Why it is used |
| GDP deflator, 1929-2025 | BEA NIPA Table 1.1.9 | Official national accounts |
| GDP-deflator definition | BEA GDP price deflator | Official definition and scope |
| Historical GDP deflator, 1900-1928 | MeasuringWorth U.S. GDP data | Johnston-Williamson reconstruction linked to BEA |
| Annual GDP-deflator cross-check | FRED A191RD3A086NBEA | Convenient distribution of official BEA series |
| CPI history and current releases | BLS CPI | Official consumer-price source |
| CPI purchasing-power formula | Minneapolis Fed inflation calculator | Transparent CPI ratio calculation |
| Federal Reserve inflation goal | Federal Reserve inflation FAQ | Official explanation of 2% PCE goal |
| Inflation breadth and alternative measures | Cleveland Fed inflation charting | Median, trimmed mean, and related tools |
| Recession dates | NBER Business Cycle Dating | Standard U.S. recession chronology |
How the 1900-1928 historical segment was joined
The historical GDP deflator was rebased to meet the official BEA index in 1929. Rebasing changes the level of an index but does not change its year-to-year percentage movements. Therefore, the pre-1929 annual inflation rates retain the growth pattern in the Johnston-Williamson reconstruction.
The 1900 rate also requires an 1899 base observation, even though the published article begins in 1900. Accordingly, the calculation uses the reconstructed 1899 index only as the prior-year denominator. The table then presents 1900 as its first visible year.
How period statistics were calculated
An arithmetic average equals the sum of annual rates divided by the number of years. In contrast, cumulative change equals the final index divided by the initial index minus one. The compound annual rate is the constant annual rate that links those two index levels.
All rankings use unrounded data. Displayed tables round annual rates to one decimal place and most period statistics to two decimals. Consequently, a reader may see tiny differences when recomputing from displayed values.
Review of additional public data sources
The following sites can help with discovery or cross-checking. However, their measure and convention should be verified before copying a number.
| Source | Link | Best use | Important caution |
| Macrotrends | Historical inflation rate by year | Quick long-run reference | Confirm source, measure, and access conditions |
| Investopedia | Inflation rate by year | Accessible explanation and December-to-December CPI table | December-to-December CPI differs from annual-average CPI and GDP deflator |
| U.S. Inflation Calculator | Current inflation rates | Fast CPI lookup | Verify against BLS for formal publication |
| BLS | Core CPI series CUUR0000SA0L1E | Official all-items-less-food-and-energy series | Core CPI is not headline CPI |
| Minneapolis Fed | CPI history and calculator | Purchasing-power conversions | CPI begins in 1913; earlier values require historical estimates |
| Trading Economics | United States inflation CPI | Current-release dashboard | Check timestamp and official source |
| World Bank | U.S. CPI inflation indicator | International comparison | Coverage begins later than the historical reconstruction |
| Cleveland Fed | Inflation charting | Alternative trend measures | Median and trimmed means answer different questions |
| FRED | CPIAUCSL | Downloadable seasonally adjusted CPI | Annual averaging and seasonal adjustment choices matter |
Editorial Checklist for Publishing This Article
Before publication, an editor should take five practical steps. First, confirm that the latest monthly CPI paragraph still names the current release. Second, preserve “GDP deflator” beside the 1900-2025 annual table. Third, keep “CPI-U” beside every dollar conversion. Fourth, update the “today” values whenever a newer CPI index becomes available. Finally, keep the early historical-estimate caveat near the data.
For SEO, the focus keyphrase appears in the title, H1, introduction, several headers, and the body without replacing natural synonyms. Related phrases such as “annual inflation,” “inflation rate last 10 years,” “U.S. inflation calculator,” “inflation rate by month,” and “inflation 2026” answer adjacent search intents. Nevertheless, the article avoids pretending that those phrases refer to one identical statistic.
Conclusion
U.S. inflation rate history from 1900 to 2025 is a history of war mobilization, financial collapse, institutional change, energy scarcity, policy experiments, supply shocks, and shifting expectations. The largest annual inflation occurred in 1917, when the GDP deflator rose 23.3%. Conversely, the sharpest deflation occurred in 1921, when it fell 14.8%.
The Great Depression then demonstrated how deflation can worsen debt and banking crises. World War II showed how controls can suppress measured inflation temporarily, while 1946-1947 showed what can happen when those controls end. Later, Vietnam-era demand pressure and two oil shocks produced the Great Inflation, while Volcker’s tightening helped restore price stability at a severe economic cost.
More recently, 9/11 created a financial and activity emergency without a broad inflation outbreak. The Great Recession even produced CPI deflation in 2009 while the GDP deflator remained positive. Finally, COVID-19 combined unusual demand, extraordinary policy support, supply constraints, labor disruptions, and commodity shocks into the largest inflation surge in four decades.
Therefore, the most useful lesson is methodological as well as historical: always ask which index, which period, and which comparison produced a number. Once those labels are clear, the annual data become a powerful guide to purchasing power, economic policy, and the forces that shape prices over time.
Full Reference List
Core data and definitions
- U.S. Bureau of Economic Analysis, GDP Price Deflator: https://www.bea.gov/data/prices-inflation/gdp-price-deflator
- U.S. Bureau of Economic Analysis, NIPA Interactive Tables: https://apps.bea.gov/iTable/?ReqID=19&step=2
- Federal Reserve Bank of St. Louis, annual GDP implicit price deflator: https://fred.stlouisfed.org/series/A191RD3A086NBEA
- MeasuringWorth, U.S. GDP and GDP deflator historical data: https://www.measuringworth.com/datasets/usgdp/
- U.S. Bureau of Labor Statistics, Consumer Price Index: https://www.bls.gov/cpi/
- U.S. Bureau of Labor Statistics, CPI calculator: https://www.bls.gov/data/inflation_calculator.htm
- Federal Reserve Bank of Minneapolis, CPI history and calculator: https://www.minneapolisfed.org/about-us/monetary-policy/inflation-calculator/consumer-price-index-1913-
- Federal Reserve Bank of St. Louis, CPI-U: https://fred.stlouisfed.org/series/CPIAUCNS
- U.S. Bureau of Economic Analysis, PCE Price Index: https://www.bea.gov/data/personal-consumption-expenditures-price-index
- Federal Reserve, why it targets 2% PCE inflation: https://www.federalreserve.gov/faqs/economy_14400.htm
World War I and the interwar economy
- Federal Reserve History, The Fed’s Role during World War I: https://www.federalreservehistory.org/essays/feds-role-during-wwi
- Federal Reserve History, Liberty Bonds: https://www.federalreservehistory.org/essays/liberty-bonds
- Federal Reserve History, The Fed’s Formative Years: https://www.federalreservehistory.org/essays/feds-formative-years
- Bureau of Labor Statistics, CPI history: https://www.bls.gov/opub/hom/cpi/history.htm
- Bureau of Labor Statistics, One Hundred Years of Price Change: https://www.bls.gov/opub/mlr/2014/article/one-hundred-years-of-price-change-the-consumer-price-index-and-the-american-inflation-experience.htm
Great Depression and World War II
- Federal Reserve History, The Great Depression: https://www.federalreservehistory.org/essays/great-depression
- Federal Reserve History, Banking Panics of 1930-1931: https://www.federalreservehistory.org/essays/banking-panics-1930-31
- Federal Reserve History, Recession of 1937-1938: https://www.federalreservehistory.org/essays/recession-of-1937-38
- Federal Reserve History, The Fed’s Role during World War II: https://www.federalreservehistory.org/essays/feds-role-during-wwii
- Federal Reserve History, World War II to the Treasury-Fed Accord: https://www.federalreservehistory.org/essays/wwii-to-the-treasury-fed-accord
- Bureau of Labor Statistics, Consumer Spending in World War II: https://www.bls.gov/opub/mlr/2015/article/consumer-spending-in-world-war-ii-the-forgotten-consumer-expenditure-surveys.htm
Korea, Vietnam, oil shocks, and Volcker
- Federal Reserve History, Treasury-Federal Reserve Accord: https://www.federalreservehistory.org/essays/treasury-fed-accord
- Federal Reserve History, Treasury-Fed Accord to the Mid-1960s: https://www.federalreservehistory.org/essays/treas-fed-accord-to-mid1960s
- Federal Reserve Bank of Richmond, monetary policy and Vietnam-era fiscal expansion: https://www.richmondfed.org/publications/research/econ_focus/2016/q3-4/federal_reserve
- Federal Reserve History, The Great Inflation: https://www.federalreservehistory.org/essays/great-inflation
- Federal Reserve History, Gold Convertibility Ends: https://www.federalreservehistory.org/essays/gold-convertibility-ends
- Federal Reserve History, Oil Shock of 1973-1974: https://www.federalreservehistory.org/essays/oil-shock-of-1973-74
- Federal Reserve History, Oil Shock of 1978-1979: https://www.federalreservehistory.org/essays/oil-shock-of-1978-79
- U.S. Energy Information Administration, crude-oil prices and disruptions: https://www.eia.gov/finance/markets/crudeoil/spot_prices.php
- Federal Reserve History, Recession of 1981-1982: https://www.federalreservehistory.org/essays/recession-of-1981-82
Recent history
- Federal Reserve History, The Great Moderation: https://www.federalreservehistory.org/essays/great-moderation
- Federal Reserve History, September 11, 2001: https://www.federalreservehistory.org/essays/september-11
- National Bureau of Economic Research, November 2001 recession announcement: https://www.nber.org/news/business-cycle-dating-committee-announcement-november-26-2001
- National Bureau of Economic Research, July 2003 trough announcement: https://www.nber.org/news/business-cycle-dating-committee-announcement-july-17-2003
- Federal Reserve History, Great Recession and Aftermath: https://www.federalreservehistory.org/essays/great-recession-and-its-aftermath
- Federal Reserve, Fiscal Policy and Excess Inflation during COVID-19: https://www.federalreserve.gov/econres/notes/feds-notes/fiscal-policy-and-excess-inflation-during-covid-19-a-cross-country-view-20220715.html
- Federal Reserve Bank of San Francisco, Global Supply-Chain Pressures and U.S. Inflation: https://www.frbsf.org/research-and-insights/publications/economic-letter/2023/06/global-supply-chain-pressures-and-us-inflation/
- Bureau of Labor Statistics, June 2022 CPI peak: https://www.bls.gov/opub/ted/2022/consumer-prices-up-9-1-percent-over-the-year-ended-june-2022-largest-increase-in-40-years.htm
- Federal Reserve, June 2022 Monetary Policy Report: https://www.federalreserve.gov/monetarypolicy/2022-06-mpr-summary.htm
- Bureau of Labor Statistics, current CPI release: https://www.bls.gov/news.release/cpi.nr0.htm