
Financial ratios are essential tools used in financial analysis, valuation, credit analysis, and corporate finance. They help investors, analysts, managers, and students understand a company’s liquidity, solvency, efficiency, profitability, and market value.
This guide explains the most important financial ratios, grouped by category, with formulas and clear interpretations.
Financial Ratios Explained: The Complete Guide to Liquidity, Leverage, Efficiency, Profitability, and Valuation
Financial ratios are among the most powerful tools in financial statement analysis, corporate finance, investment analysis, and valuation. Used correctly, they transform raw accounting numbers into meaningful insights about a firm’s liquidity, risk, efficiency, profitability, and market value.
This guide provides a complete, structured, and practical explanation of the most important financial ratios, including formulas, intuition, interpretation, limitations, and a ranking of the ratios most commonly used by analysts, investors, lenders, and managers.
Why Financial Ratios Matter
Financial statements alone can be misleading because companies differ in size, capital structure, and industry. Financial ratios solve this problem by allowing:
- Comparability across firms
- Trend analysis over time
- Risk and performance evaluation
- Creditworthiness assessment
- Valuation and investment decisions
Ratios are most powerful when:
- Compared over time
- Benchmarked against industry averages
- Used together, not in isolation
I. Liquidity Ratios (Short-Term Solvency)
Liquidity ratios measure a firm’s ability to meet short-term obligations using short-term assets.
1. Current Ratio
Formula:
Current Assets ÷ Current Liabilities
What it measures:
Overall short-term liquidity.
Interpretation:
- 1.0 → firm can cover current obligations
- Too high → inefficient use of working capital
- Too low → potential liquidity stress
Limitation:
Not all current assets are equally liquid.
2. Quick Ratio (Acid-Test Ratio)
Formula:
(Current Assets − Inventory) ÷ Current Liabilities
What it measures:
Liquidity excluding inventory.
Why it matters:
Inventory may be slow-moving, obsolete, or overvalued.
Interpretation:
More conservative than the current ratio.
3. Cash Ratio
Formula:
Cash ÷ Current Liabilities
What it measures:
Extreme liquidity — ability to pay liabilities using only cash.
Who uses it:
Short-term creditors and stress-test scenarios.
II. Long-Term Solvency and Leverage Ratios
These ratios assess how a firm finances itself and how risky its capital structure is.
4. Total Debt Ratio
Formula:
(Total Assets − Total Equity) ÷ Total Assets
What it measures:
Proportion of assets financed with debt.
Interpretation:
Higher values imply greater financial risk.
5. Debt-Equity Ratio
Formula:
Total Debt ÷ Total Equity
What it measures:
Relative use of debt versus shareholders’ equity.
Interpretation:
- High → aggressive leverage
- Low → conservative financing
6. Equity Multiplier
Formula:
Total Assets ÷ Total Equity
What it measures:
Financial leverage used by shareholders.
Key relationship:
Equity Multiplier = 1 + Debt-Equity Ratio
7. Times Interest Earned (TIE)
Formula:
EBIT ÷ Interest Expense
What it measures:
Ability to cover interest payments with operating income.
Interpretation:
- < 1 → financial distress
- Higher → safer debt position
8. Cash Coverage Ratio
Formula:
(EBIT + Depreciation + Amortization) ÷ Interest
What it measures:
Interest coverage using cash-based earnings (EBITDA).
Why it matters:
Interest is paid with cash, not accounting profits.
III. Asset Management (Efficiency) Ratios
These ratios show how efficiently a firm uses its assets to generate revenue.
9. Inventory Turnover
Formula:
Cost of Goods Sold ÷ Inventory
What it measures:
How many times inventory is sold during the year.
Interpretation:
- High → efficient inventory management
- Too high → risk of stockouts
10. Days’ Sales in Inventory (DSI)
Formula:
365 ÷ Inventory Turnover
What it measures:
Average number of days inventory remains unsold.
11. Receivables Turnover
Formula:
Sales ÷ Accounts Receivable
What it measures:
Speed of collecting credit sales.
12. Days’ Sales in Receivables (DSR / ACP)
Formula:
365 ÷ Receivables Turnover
What it measures:
Average collection period.
Interpretation:
Longer periods may indicate weak credit control.
13. Total Asset Turnover
Formula:
Sales ÷ Total Assets
What it measures:
Sales generated per dollar of assets.
Industry note:
Capital-intensive industries naturally have lower turnover.
IV. Profitability Ratios
Profitability ratios measure how effectively a firm converts sales into profits.
14. Profit Margin
Formula:
Net Income ÷ Sales
What it measures:
Net profit per dollar of sales.
15. EBITDA Margin
Formula:
EBITDA ÷ Sales
What it measures:
Operating cash profitability before financing and taxes.
Why analysts use it:
Improves comparability across firms.
16. Return on Assets (ROA)
Formula:
Net Income ÷ Total Assets
What it measures:
Efficiency in generating profits from assets.
17. Return on Equity (ROE)
Formula:
Net Income ÷ Total Equity
What it measures:
Return earned for shareholders.
DuPont identity:
ROE = Profit Margin × Asset Turnover × Equity Multiplier
V. Market Value and Valuation Ratios
Used primarily for publicly traded companies.
18. Earnings Per Share (EPS)
Formula:
Net Income ÷ Shares Outstanding
What it measures:
Profit attributable to each share.
19. Price-Earnings (P/E) Ratio
Formula:
Price per Share ÷ Earnings per Share
What it measures:
Market expectations of growth and risk.
Caution:
High P/E does not always mean overvalued.
20. Market-to-Book Ratio
Formula:
Market Value per Share ÷ Book Value per Share
What it measures:
Market valuation relative to accounting equity.
21. Market Capitalization
Formula:
Price per Share × Shares Outstanding
What it measures:
Total market value of equity.
22. Enterprise Value (EV)
Formula:
Market Capitalization + Debt − Cash
What it measures:
Value of the firm’s operating assets.
Why EV matters:
Reflects the true cost to acquire the firm.
23. Enterprise Value Multiple (EV/EBITDA)
Formula:
Enterprise Value ÷ EBITDA
What it measures:
Valuation independent of capital structure.
Widely used in:
M&A, private equity, investment banking.
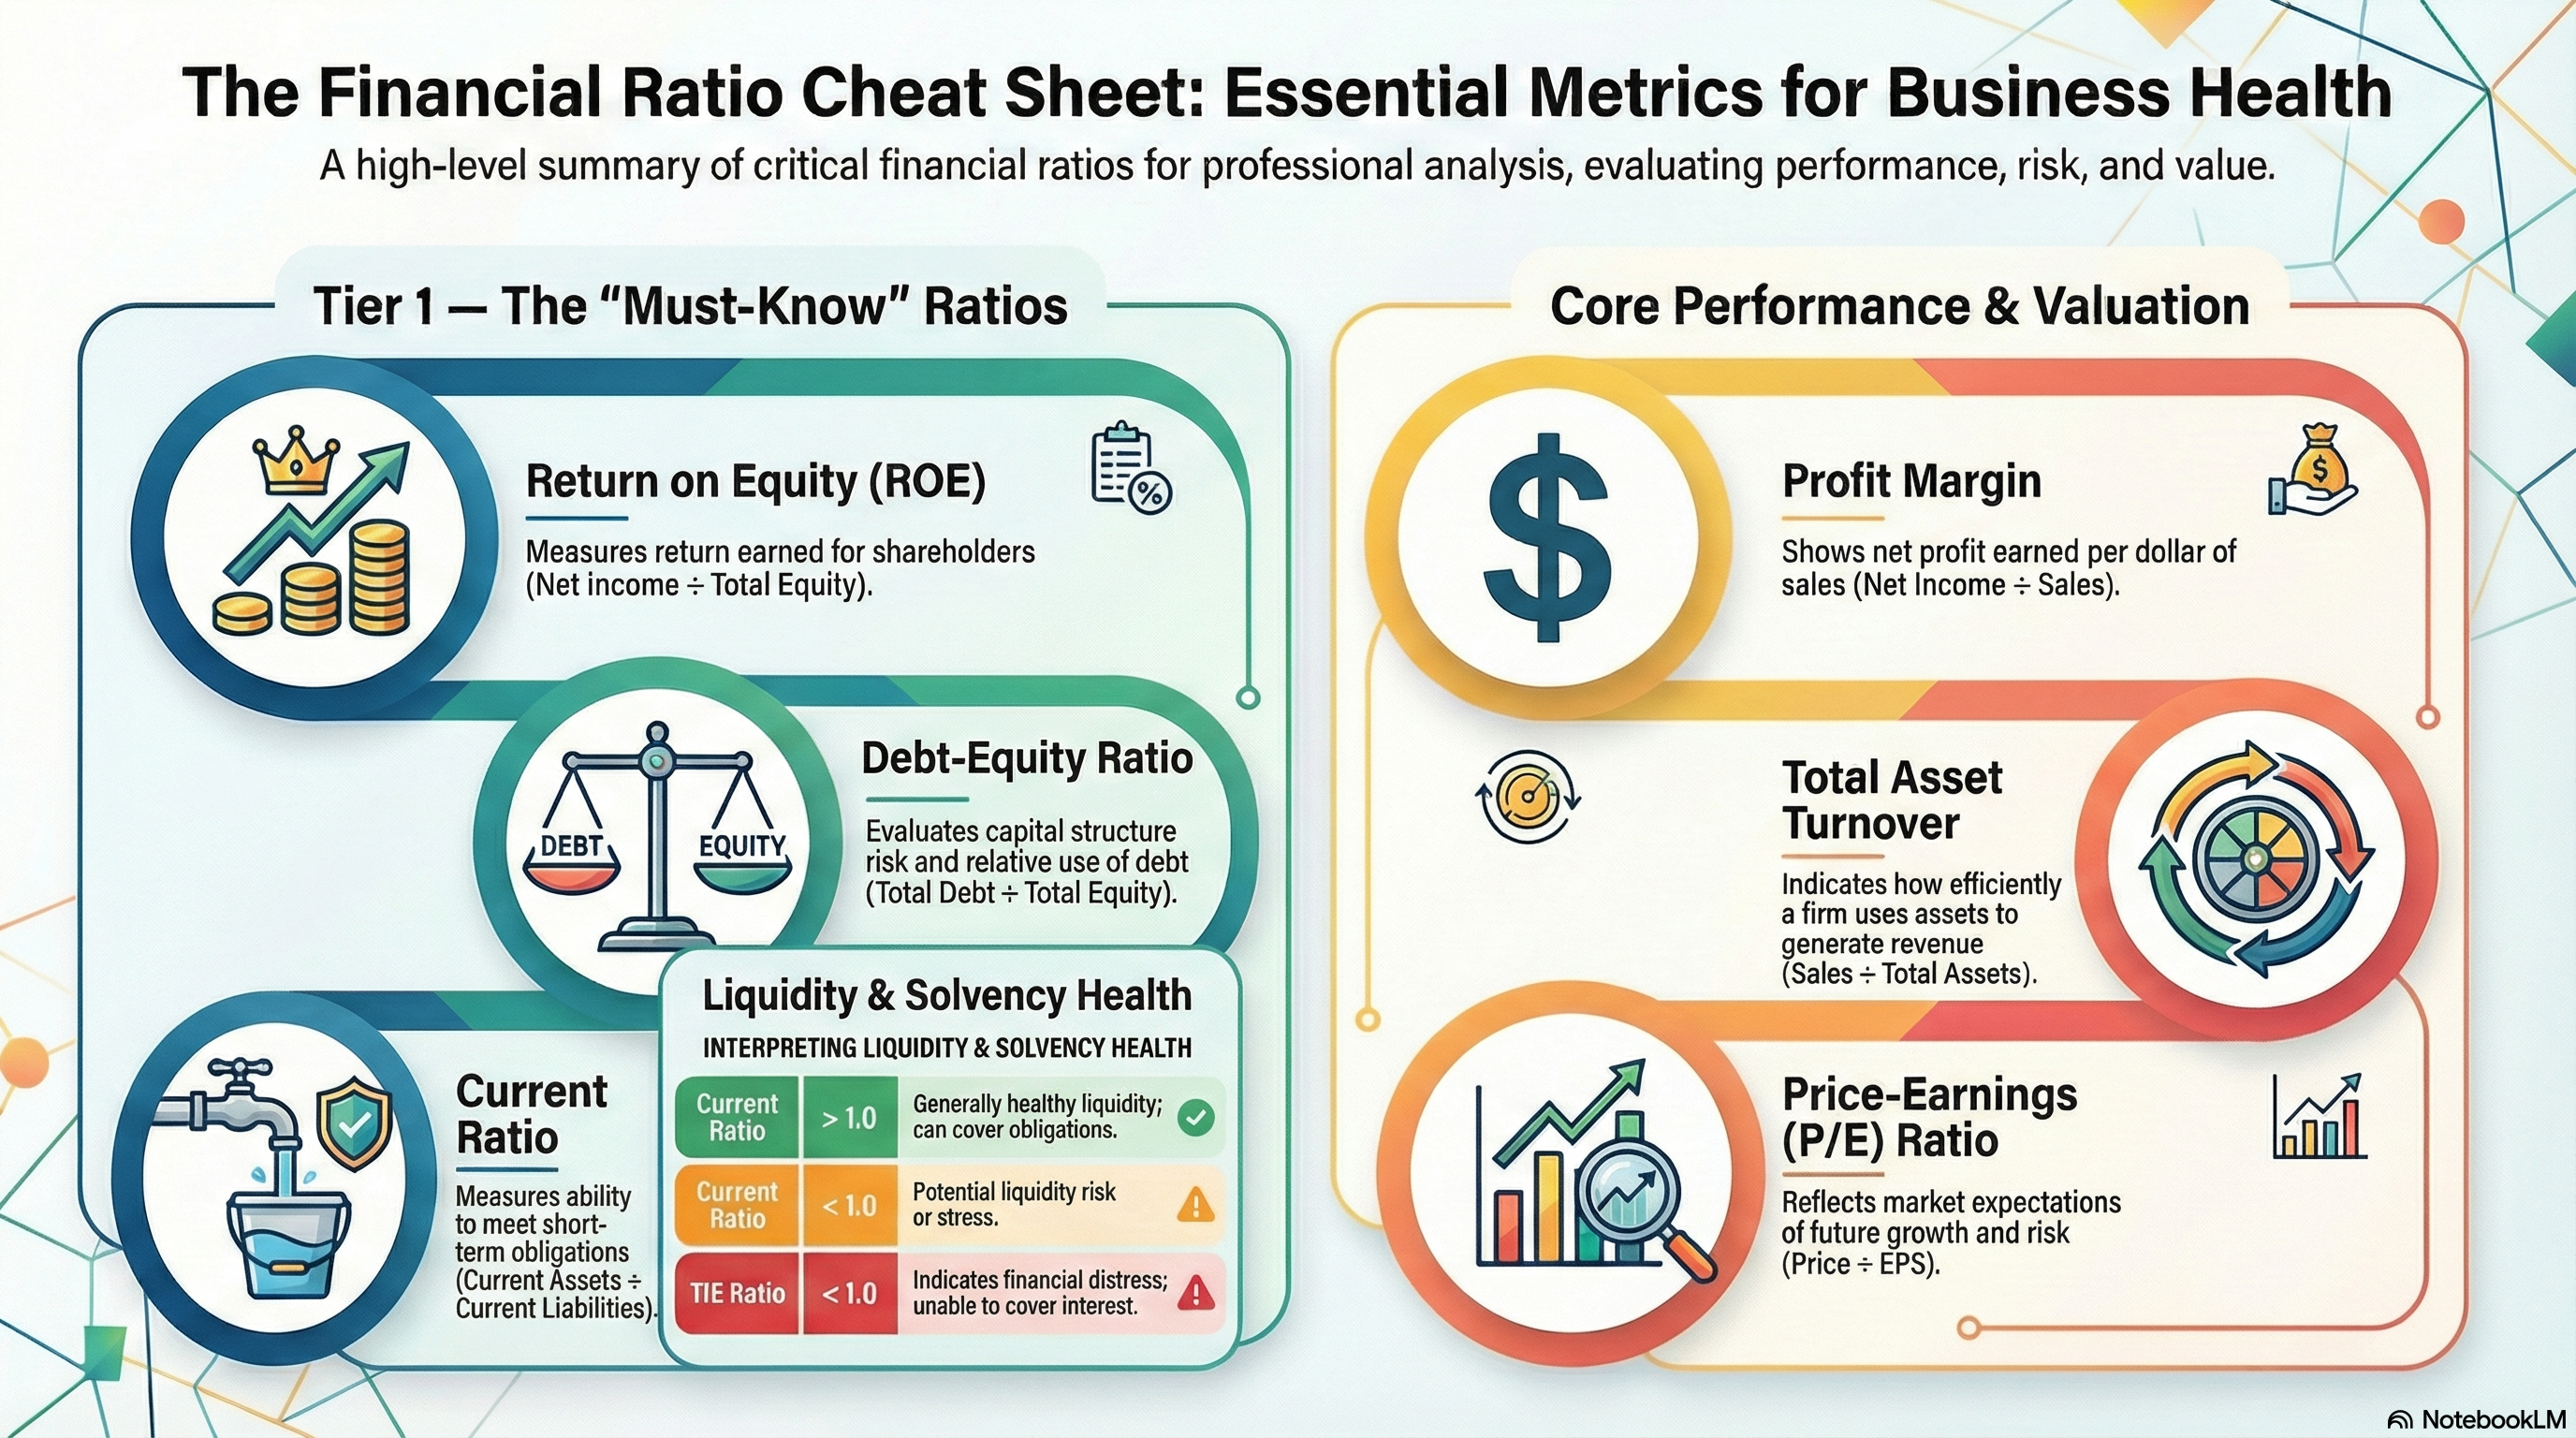
Ranking: Most Important Financial Ratios (Real-World Use)
Tier 1 – Core Ratios (Must Know)
- ROE
- ROA
- Debt-Equity Ratio
- Current Ratio
- Profit Margin
- EBITDA Margin
Tier 2 – Strong Analytical Power
- Total Asset Turnover
- Times Interest Earned
- Inventory Turnover
- Receivables Turnover
- P/E Ratio
Tier 3 – Valuation & Advanced Analysis
- Enterprise Value
- EV/EBITDA
- Market-to-Book Ratio
- Equity Multiplier
- Cash Coverage Ratio
Final Takeaway
Financial ratios are not answers — they are signals.
The real skill in financial analysis lies in interpreting ratios together, understanding industry context, and recognizing trade-offs between risk, profitability, and growth.
If you master these ratios, you master the language of finance.